Before reviewing the exceptional returns of our portfolios in 2023, let’s take a look at some of the key factors that explain the year in the financial markets.
Year 2023 and last quarter generally positive
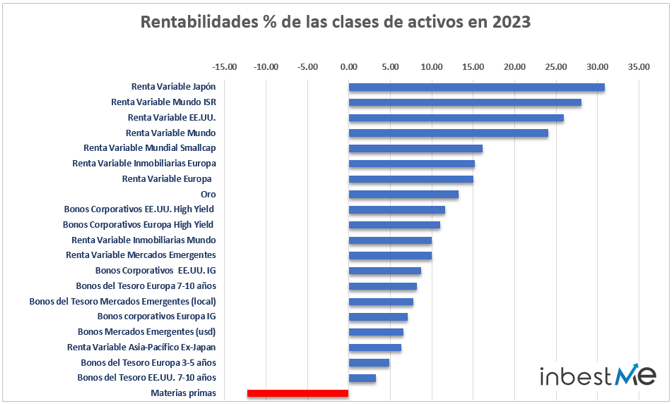
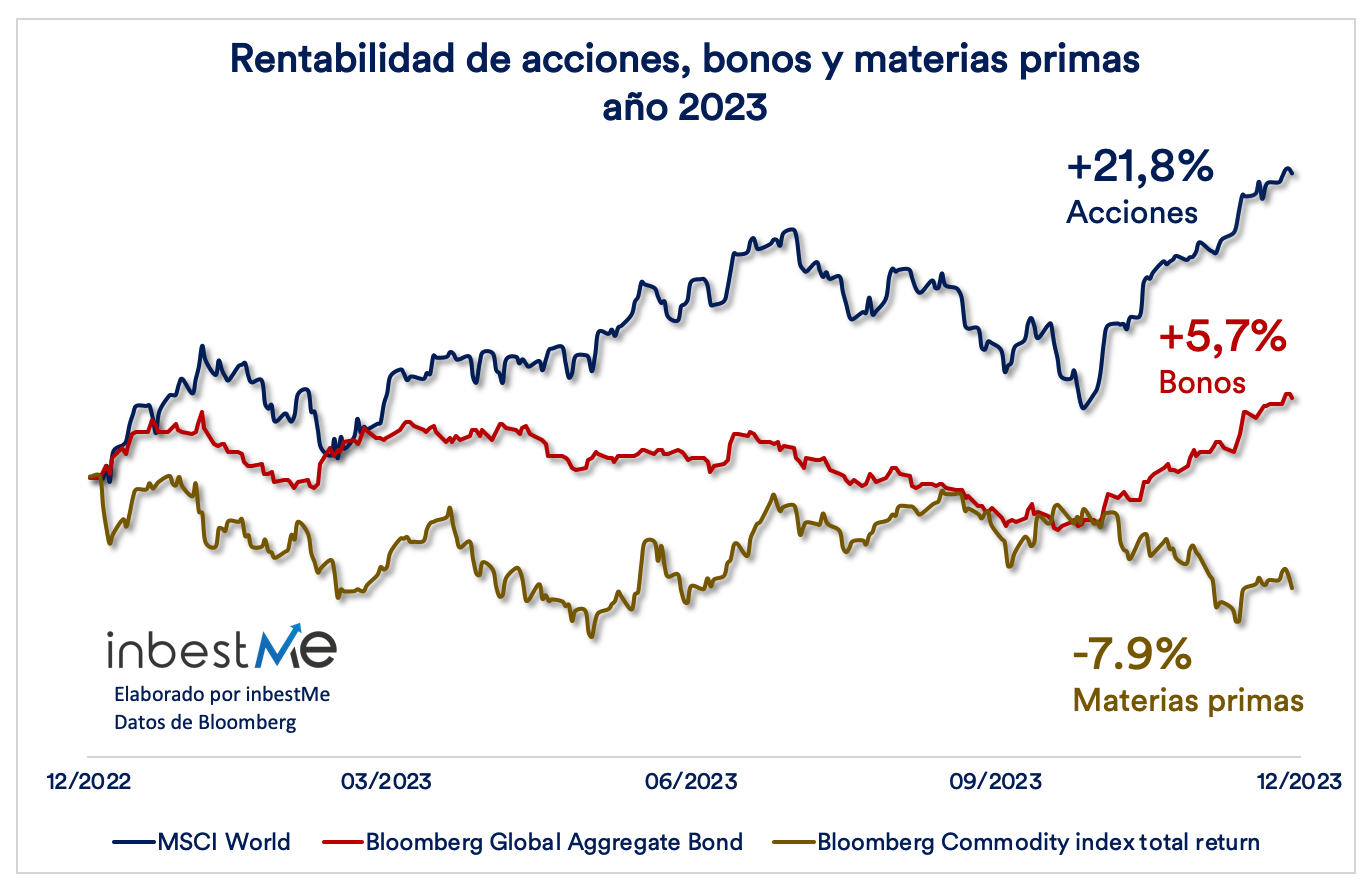
In the last quarter of 2023, financial asset prices saw a marked improvement, despite persistent tensions in the Middle East. As a result, the year closed very positively for financial assets, which was quite surprising given initial expectations. The MSCI World index rose by 24.4% and the Bloomberg Global Aggregate bond index rose by 5.7%. In contrast to 2022, commodities closed the year in negative territory, down 7.9%.
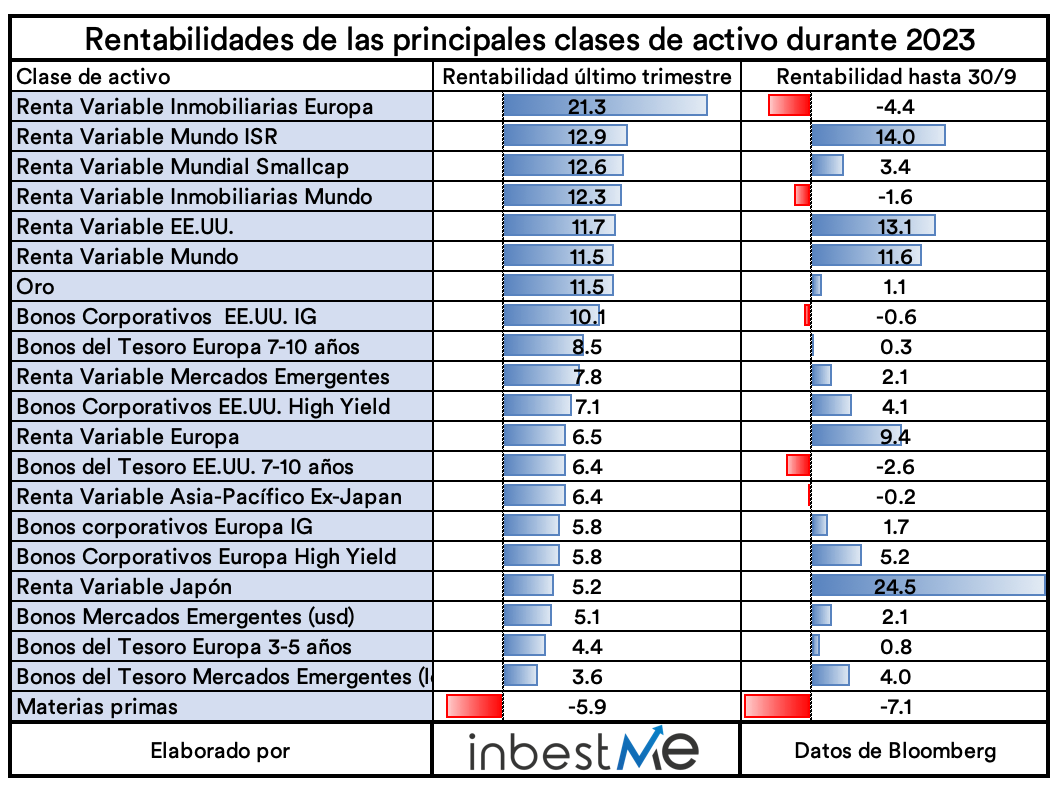
Many of the assets that performed better in the fourth quarter of the year were those that had been penalized the most in the first part of the year (see report as of September 2023), such as real estate and small caps. In addition, the positive performance of fixed income was basically all achieved in the last quarter. In the preceding months, bonds had fallen and only recovered at the end.
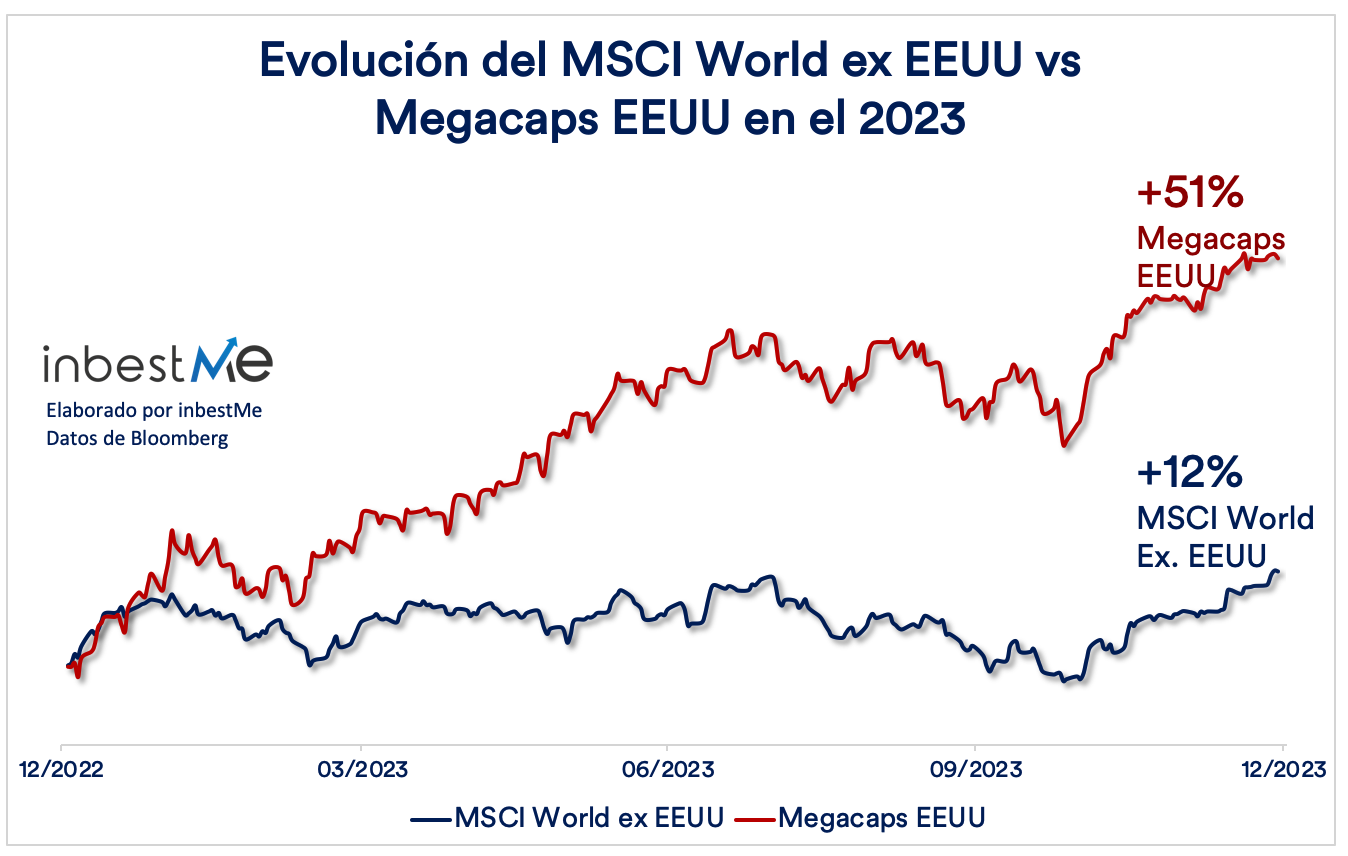
It is worth mentioning that the performance of the global indices was attributable to a handful of U.S. “megacaps” (mega-cap companies) that were primarily driven by the euphoria around Artificial Intelligence. This means that, despite the strong performance of the indices, a large number of the other stocks did not perform well at all. The concentration of performance, which is a feature of these years, was particularly strong in 2023, as seen in the chart below.
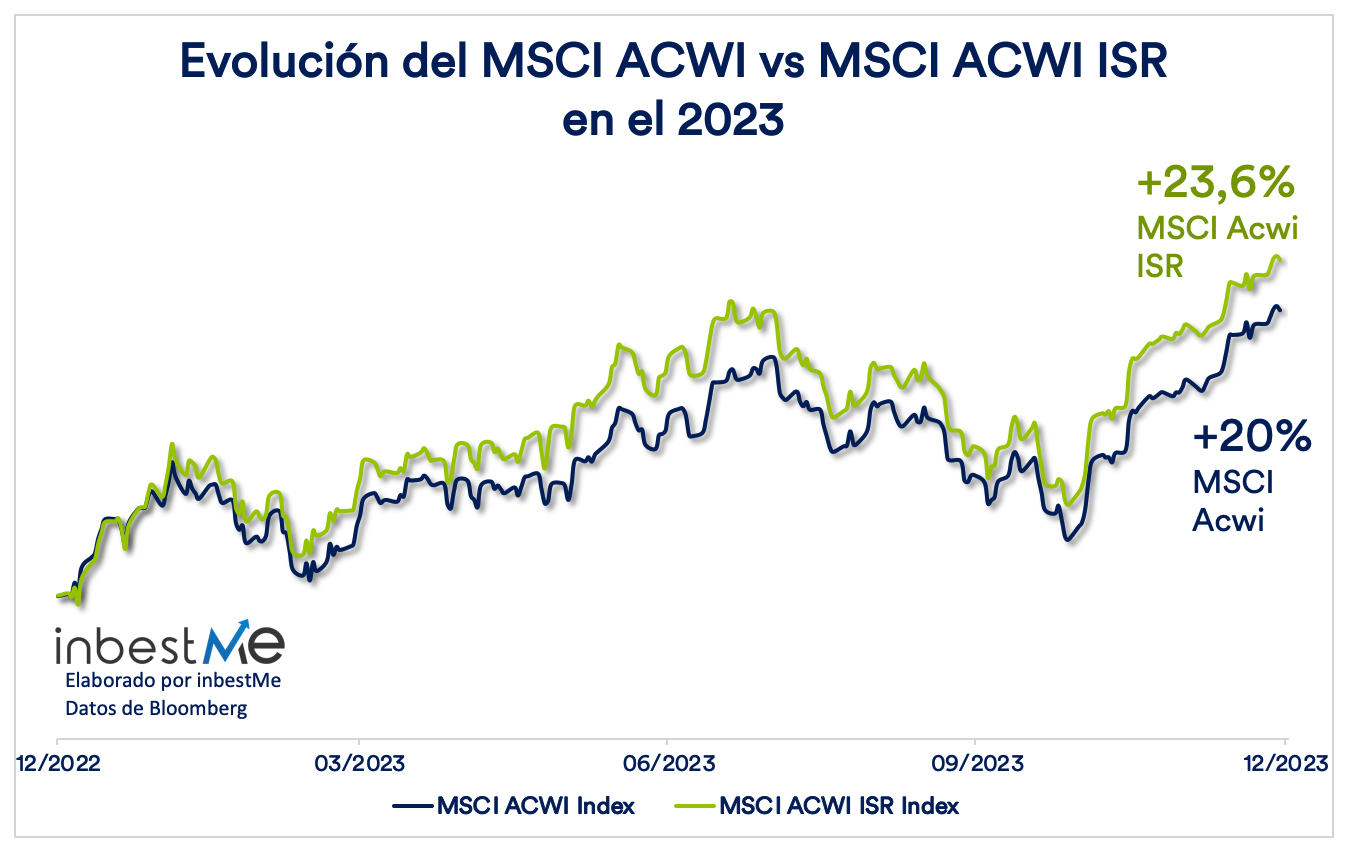
The outperformance of technology also boosted the performance of SRI (equity) indexes, which generally have a higher weight in technology than conventional indexes, as seen in the chart below.
Bonds lagging, commodities generally in negative territory
Bonds were in negative territory for most of the year, as interest rates continued to rise overall for most of the year (again recalling the inverse relationship between yields and prices). It was only at the end of the year that bonds recovered thanks to expectations of rate cuts by central banks.
As for commodities, this year was not as good as 2022 and commodity indices ended the year in the negative. Even the Middle East crisis did not push up the price of oil, as feared, and it ended the year approximately 11% lower.
Gold, on the other hand, which is the only commodity we hold in some of our portfolios (ETFs), performed better and ended the year positive by more than 12%.
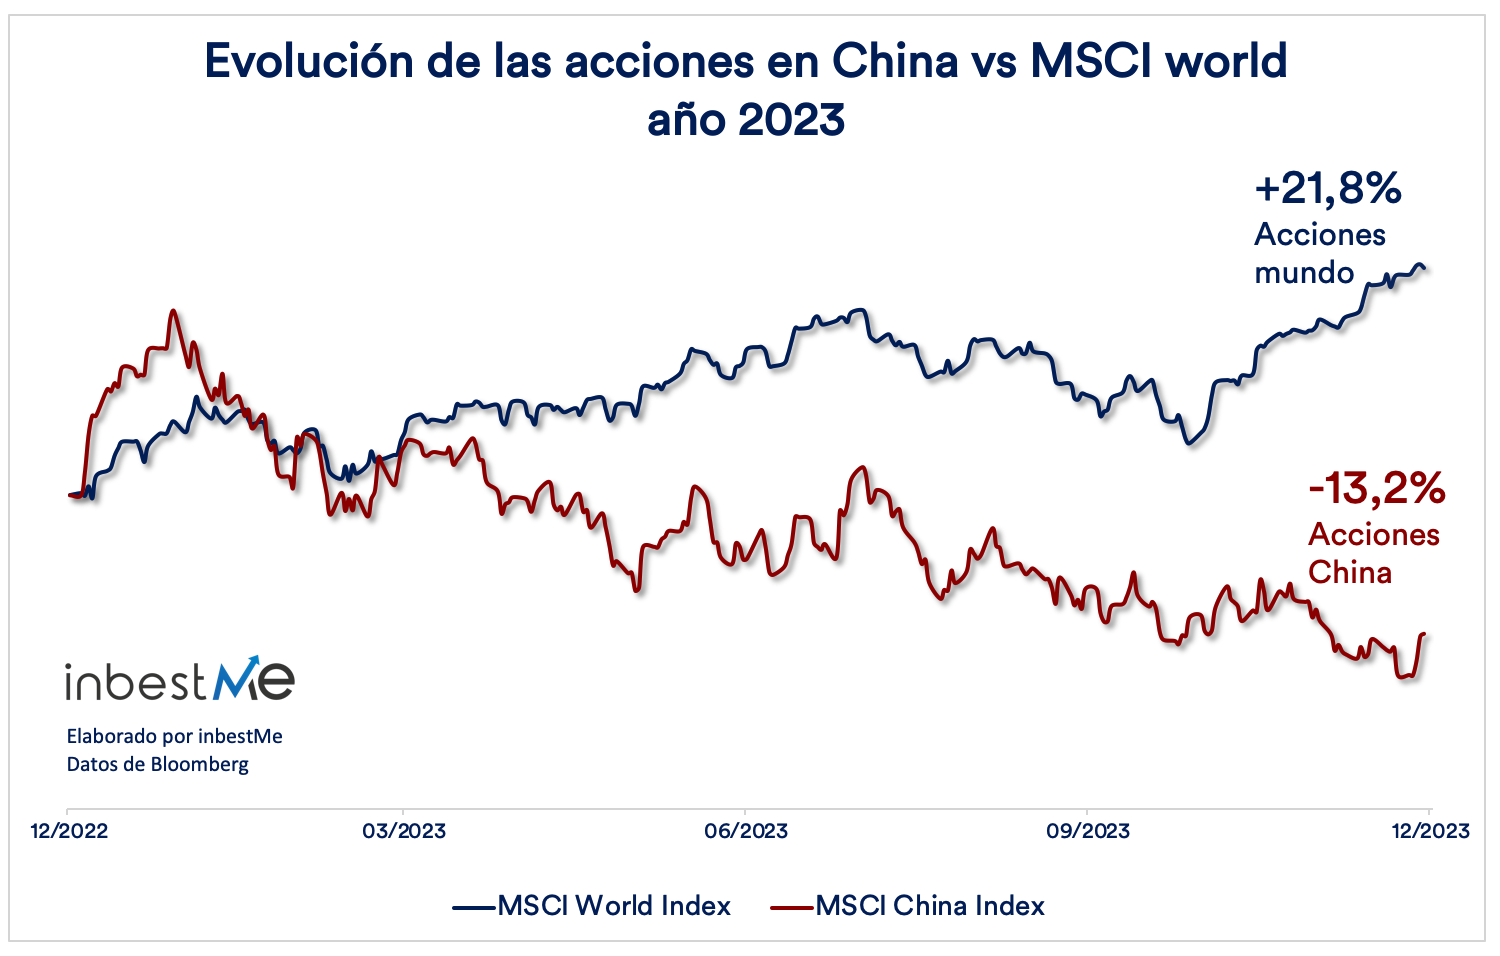
China and emerging markets in negative
At the beginning of 2023, China’s reopening after the pandemic was expected to be very beneficial for the stock market. Instead, consumption in China remained quite low and a major real estate crisis continued to unfold. This was compounded by rising geopolitical tensions that discouraged many foreign institutional investors from investing in China. China’s underperformance had a negative impact on emerging markets.

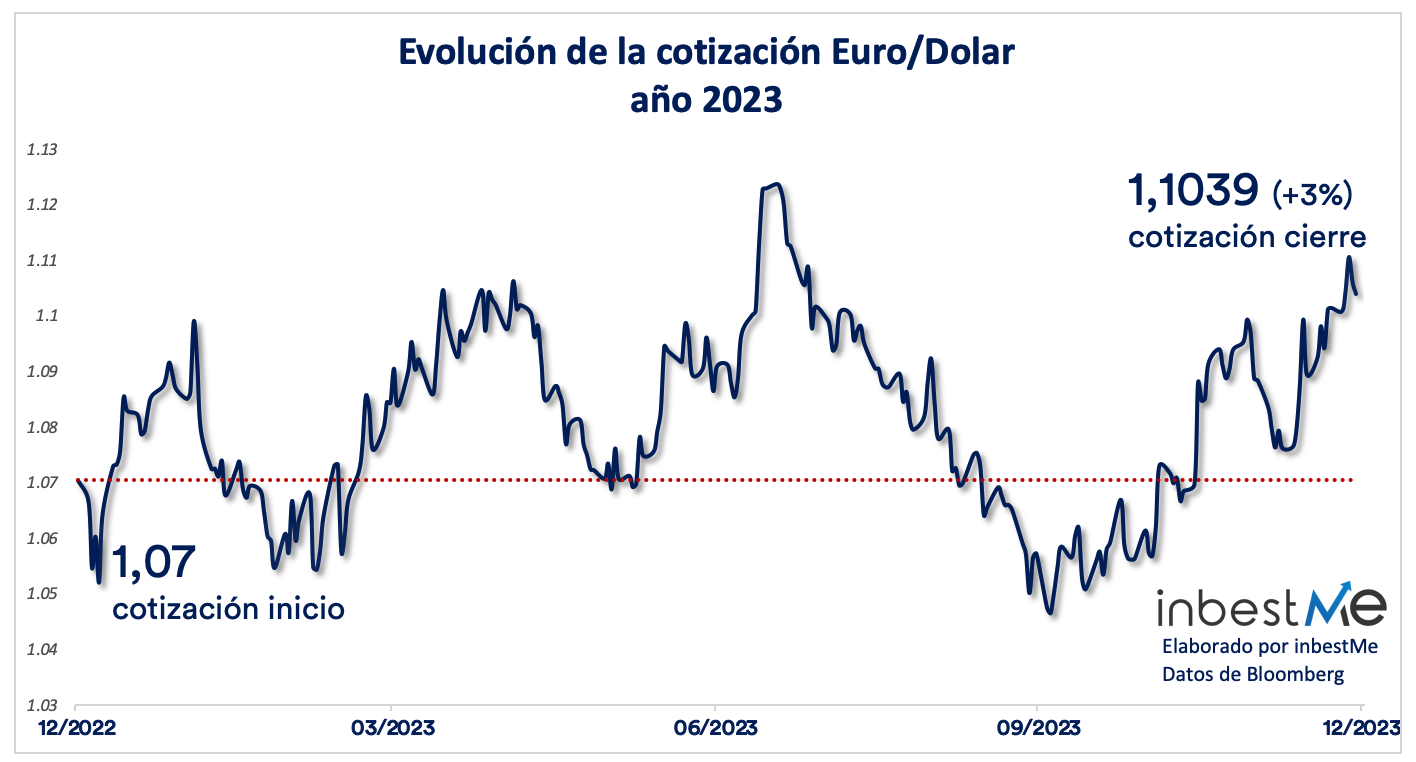
Slight appreciation of the euro
As for the euro, it closed the year with an appreciation against the dollar, despite the fact that the European economy proved to be much more stagnant than the U.S. economy. Much of the economic weakness in Europe was probably already discounted by the markets.
Although we will talk about them in passing, you can see an additional and specific report on:
- Rentabilidades de las carteras de planes de pensiones a cierre 2023
- Rentabilidades de las carteras de fondos indexados ISR a cierre 2023
- Desempeño de las carteras de ETFs Dynamic al cierre de 2023
- Rentabilidades de las Carteras Ahorro a cierre 2023
- Rentabilidades de las Carteras de Bonos a cierre 2023
Here and below we will focus in particular on the portfolios of index funds and Euro Standard ETFs.
Performance of standard index fund portfolios
The performance of our two main lines of model index fund portfolios* oriented to long-term investment of both index funds and standard ETFs (see below) has been exceptionally positive throughout this 2023 and especially at year-end and well above expected returns.
Above-expected returns are, on the one hand, exceptional, but in reality they have a certain degree of “normality”. Recall that the annualized expected returns we report are still a long-term “average” and as such are unlikely to occur as such in a specific year. After a year 2022, well below expectations, it has some degree of normality for a reversion to the mean to occur. We investors have been fortunate that this reversion occurred in this 2023, although as we have seen it focused on equities.
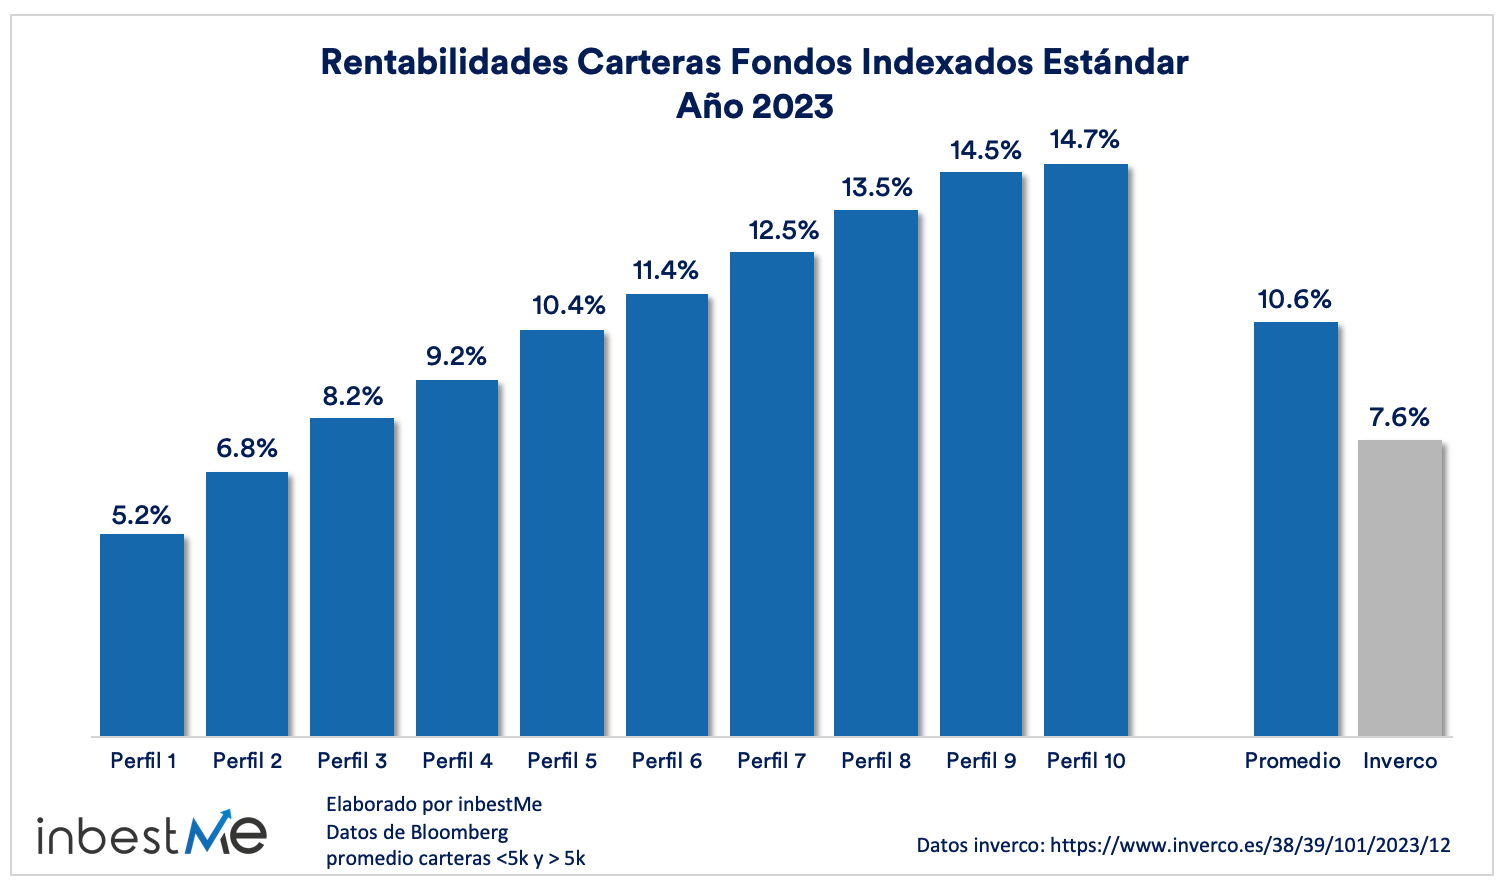
Important note: following the relaunch and expansion of the bond portfolios (profile 0) we have decided to report these portfolios separately.
As we can see in the graph above, the returns of the Standard index fund portfolios have ranged from 5.2% for profile 1 to 14.7% for profile 10, and the average of 10.6% is 3 percentage points higher than the average weighted return of mutual funds in Spain according to Inverco, which closed the year at 7.6%. The return obtained is approximately double the expected annual return in all profiles.
Important note: the returns we report here do not pertain to any one client. They are the returns of the model portfolios for each profile and we believe they are the closest representation of the average inbestMe client in each profile. As such, they are always perfectly balanced, have no impact of capital inflows, no impact of withholding taxes, and no positive or negative impact of profile changes. For index fund portfolios they are an average between the returns of portfolios <5,000 € and >5,000 €. For all these reasons, a client’s performance may be somewhat different from what we report here.
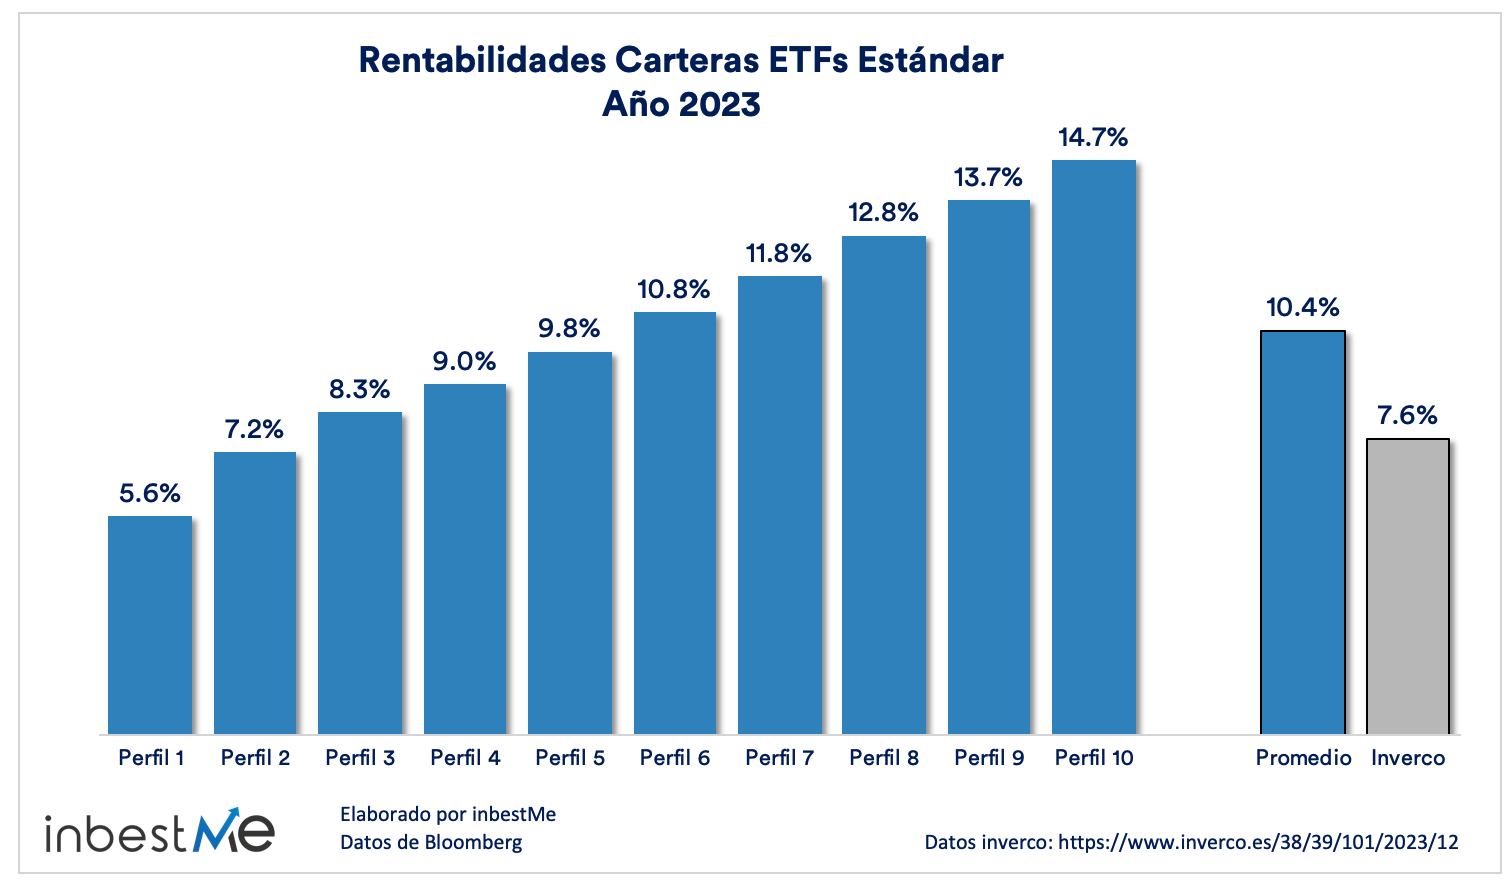
Performance of standard ETF portfolios
The evolution of the standard ETF portfolios has been very similar (remember that they are conceptually constructed the same, although they have a small exposure to gold).
Important note: following the relaunch and expansion of the bond portfolios (profile 0) we have decided to report these portfolios separately.
As we can see in the graph above, the returns of the Standard ETF portfolios have ranged from 5.6% for profile 1 to 14.7% for profile 10, and the average of 10.4% is 2.8 percentage points higher than the average weighted return of mutual funds in Spain according to Inverco, which closed the year at 7.6%. As in the case of index fund portfolios, the return obtained is approximately double the expected annual return in all profiles.
It is important to highlight for investors with lower or intermediate profiles that the positive returns of this 2023 do not yet offset the very negative returns of 2022, and investors who entered them in late 2021 or early 2022 and may still be slightly negative or flat depending on the risk profile. Certainly, some of them may have the feeling that their portfolios are still “not getting back on their feet”.
This effect is mainly due to the fixed income component, which suffered historic declines in 2022 (around 16%). Although as we have already reported above in the last quarter it has recovered, closing at +5.7% it is not enough to compensate for the falls in 2022.
Let us remember that all our Diversified Index Fund portfolios are designed for the medium to long term (minimum 3 years) and it is in those terms that we believe they should be analyzed.
Below we analyze the long-term performance of our portfolios, for which they have been designed, but first, in the next section, we make a quick review of all our portfolios.
Comparative performance of the different inbestMe portfolios at year-end 2023
The average return in 2023 of all portfolios in inbestMe was an exceptional 10.1% or 2.5 percentage points above the average weighted return of mutual funds in Spain (according to Inverco).
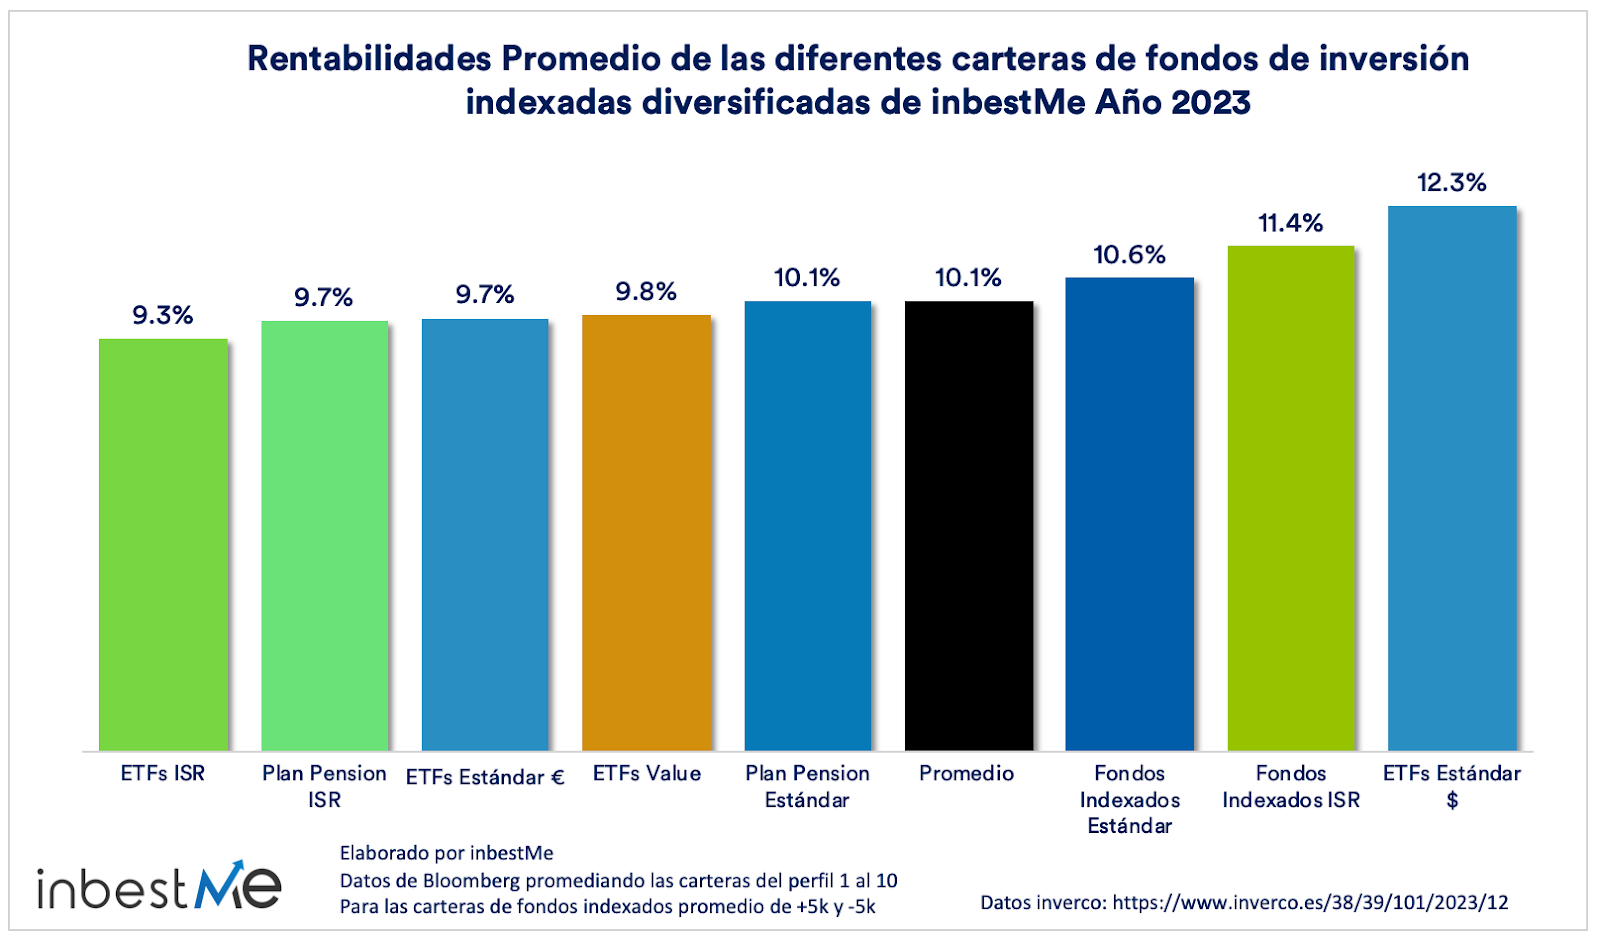
The best performing portfolios were the dollar-denominated portfolios, achieving 11.4% on average for Dynamic and 12.3% for Standard (2.2 points above average), thanks to the higher exposure to US equities (which has once again led the recovery in the stock markets).
SRI index fund portfolios followed, showing an impressive return of 11.4% on average, outperforming the already positive 10.6% return of Standard Index Fund Portfolios by 0.8 percentage points.
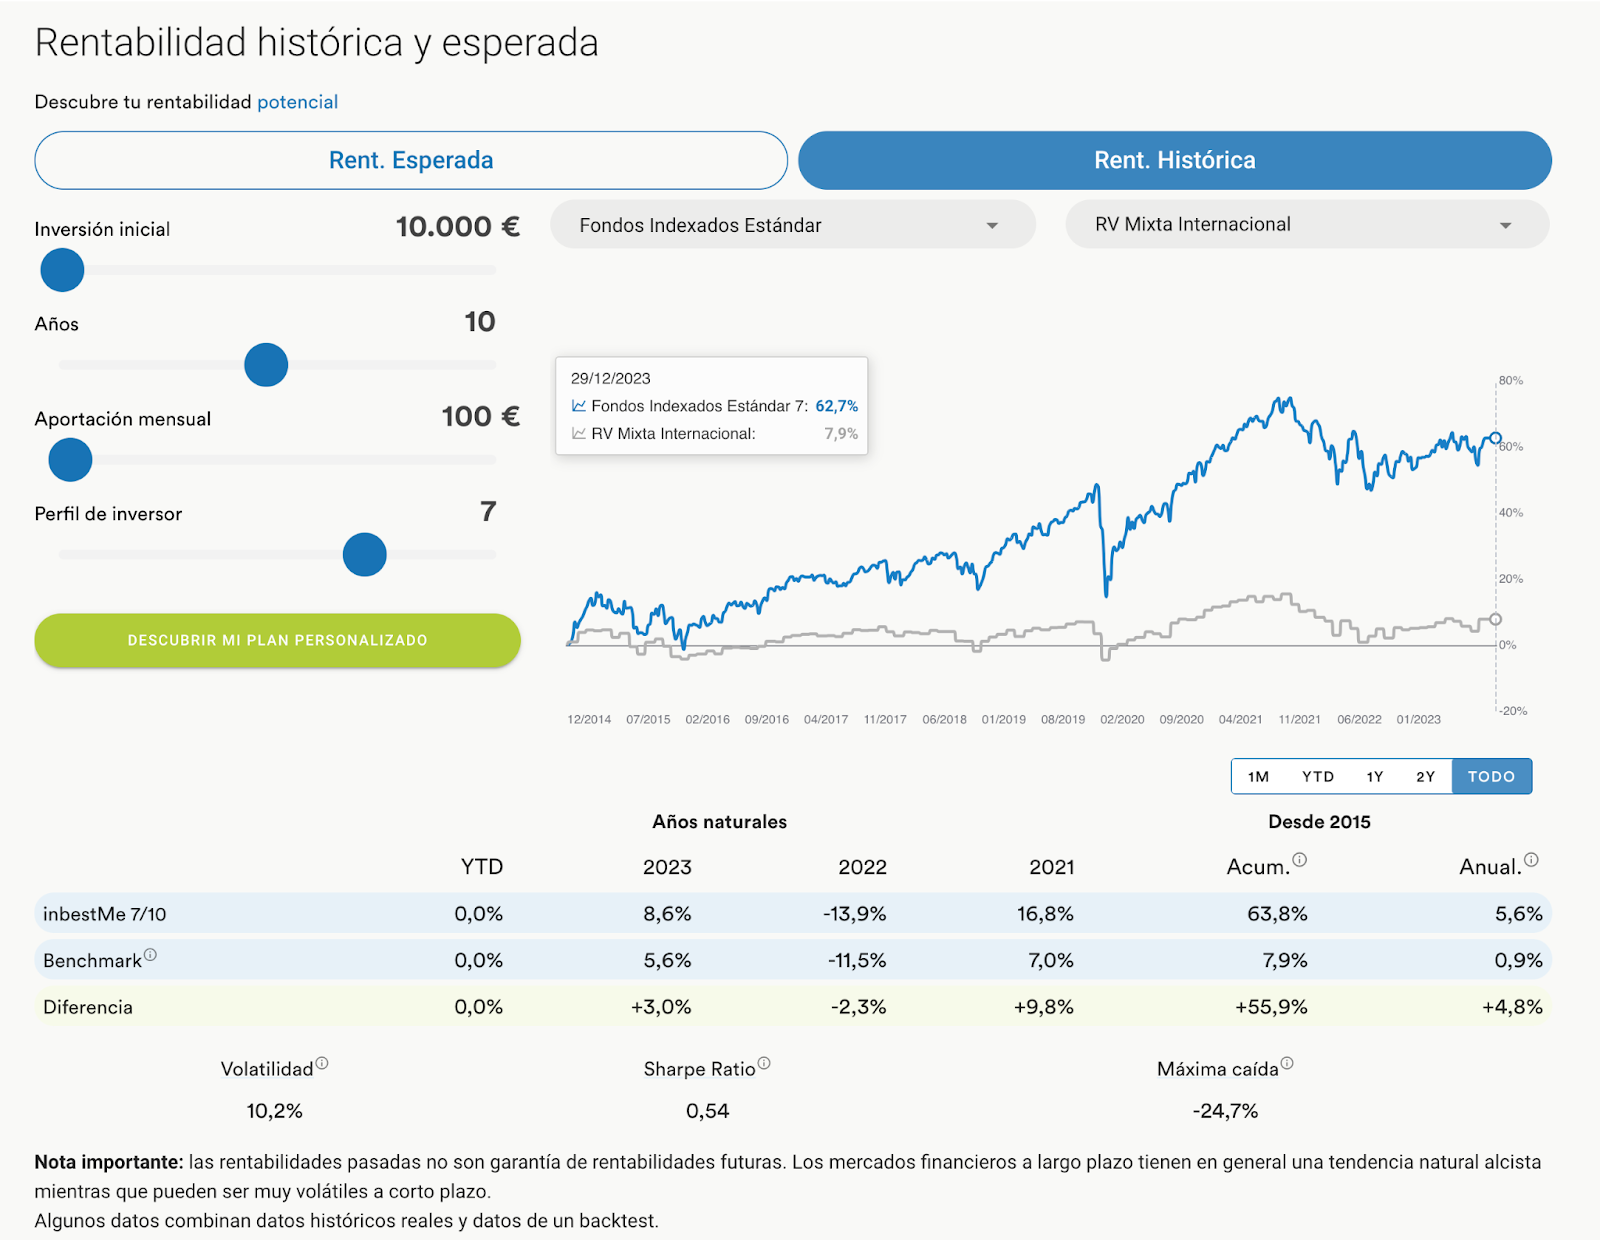
We remind you that if you want to see more details about the performance of our portfolios (in this period or in others and for all risk profiles) you can consult the inbestMe performance page on our website where you will find the comparison with other benchmarks and risk ratios such as volatility, Sharpe Ratio and drawdown and for the different risk profiles and periods.

Performance of diversified index mutual fund portfolios since their inception
Since January 2015, when the inbestMe investment model was conceptualized, we have been continuously monitoring our index mutual fund portfolios. Since that time, our portfolios have undergone significant stress testing to assess their robustness. The economic and financial market challenges in the aftermath of the pandemic have been unprecedented. This was compounded by uncertainties during 2022 due to resurgent inflation and various geopolitical tensions, first in 2022 due to the war in Ukraine and during late 2023 due to the crisis between Israel and Hamas.
Our index mutual fund portfolios are designed with a long-term view. Therefore, while temporary setbacks are inherent to financial markets, we expect the portfolios to demonstrate resilience and sustained growth over time.
In summary, despite the adversities faced in recent periods, all of our portfolios have generated positive returns since inception.
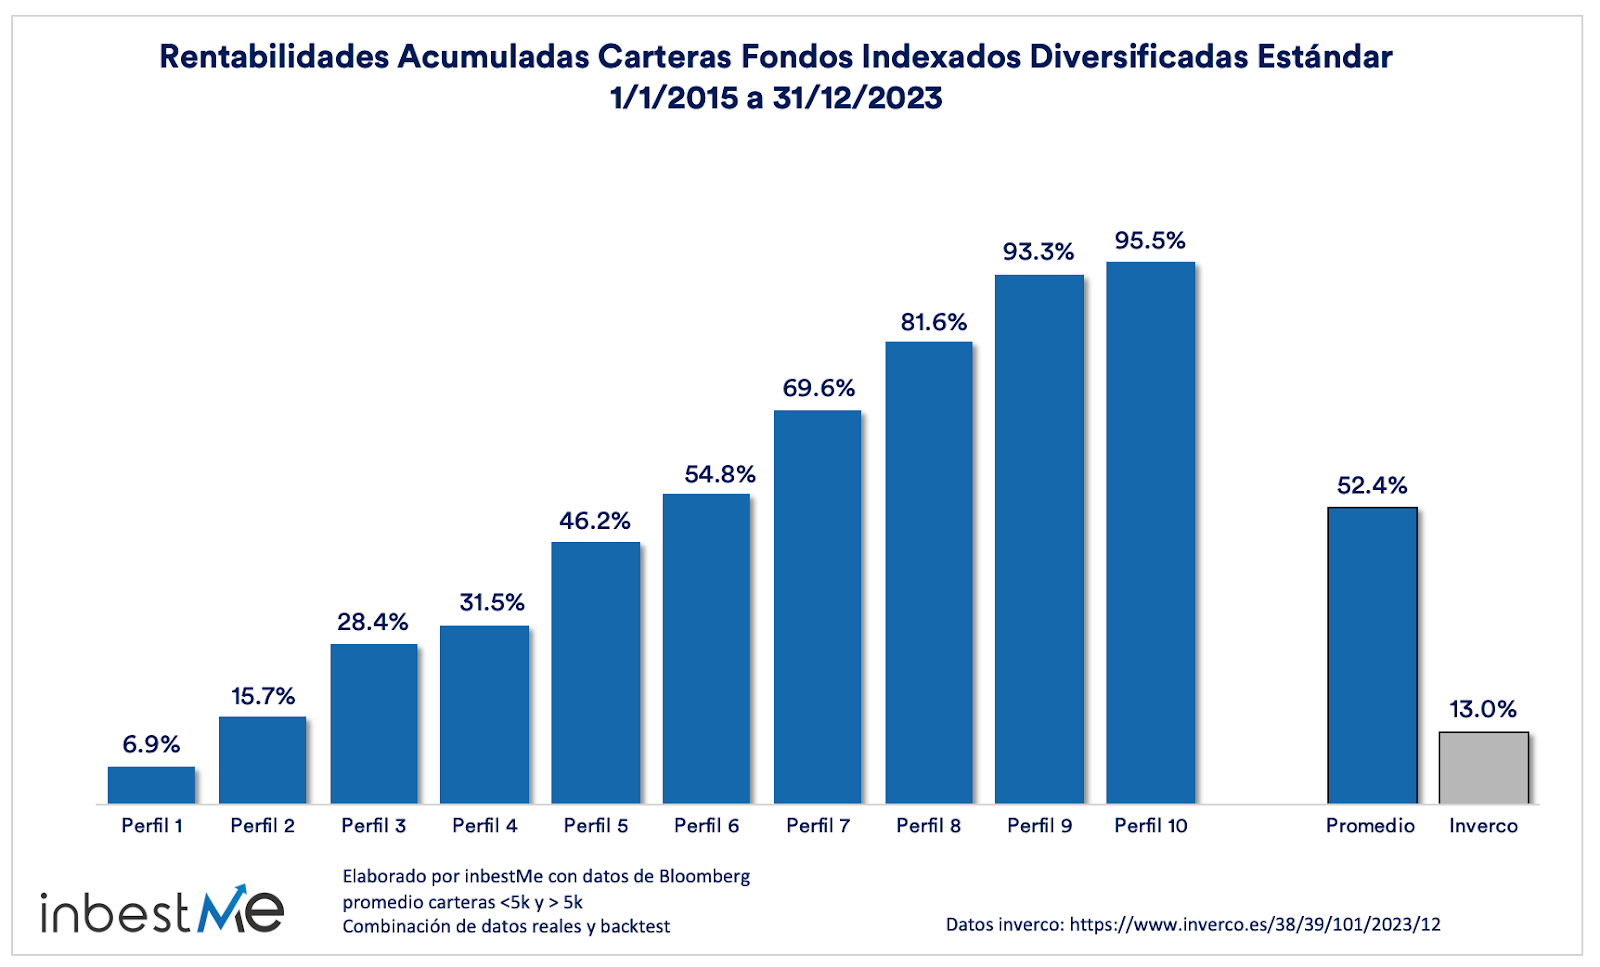
Since their inception, and as can be seen in the graph above, our index mutual fund portfolios have recorded a range of cumulative returns varying from 6.9% to 95.5%. The average cumulative return of our Standard diversified index fund portfolios has been 52.4% , while the average for mutual funds in Spain, according to Inverco, over the same period is 13%.
The average cumulative return of our Standard Diversified Index Fund Portfolios is almost 40 percentage points higher (52.4%-13%= 39.4%) than the weighted average of mutual funds, according to Inverco over this period.
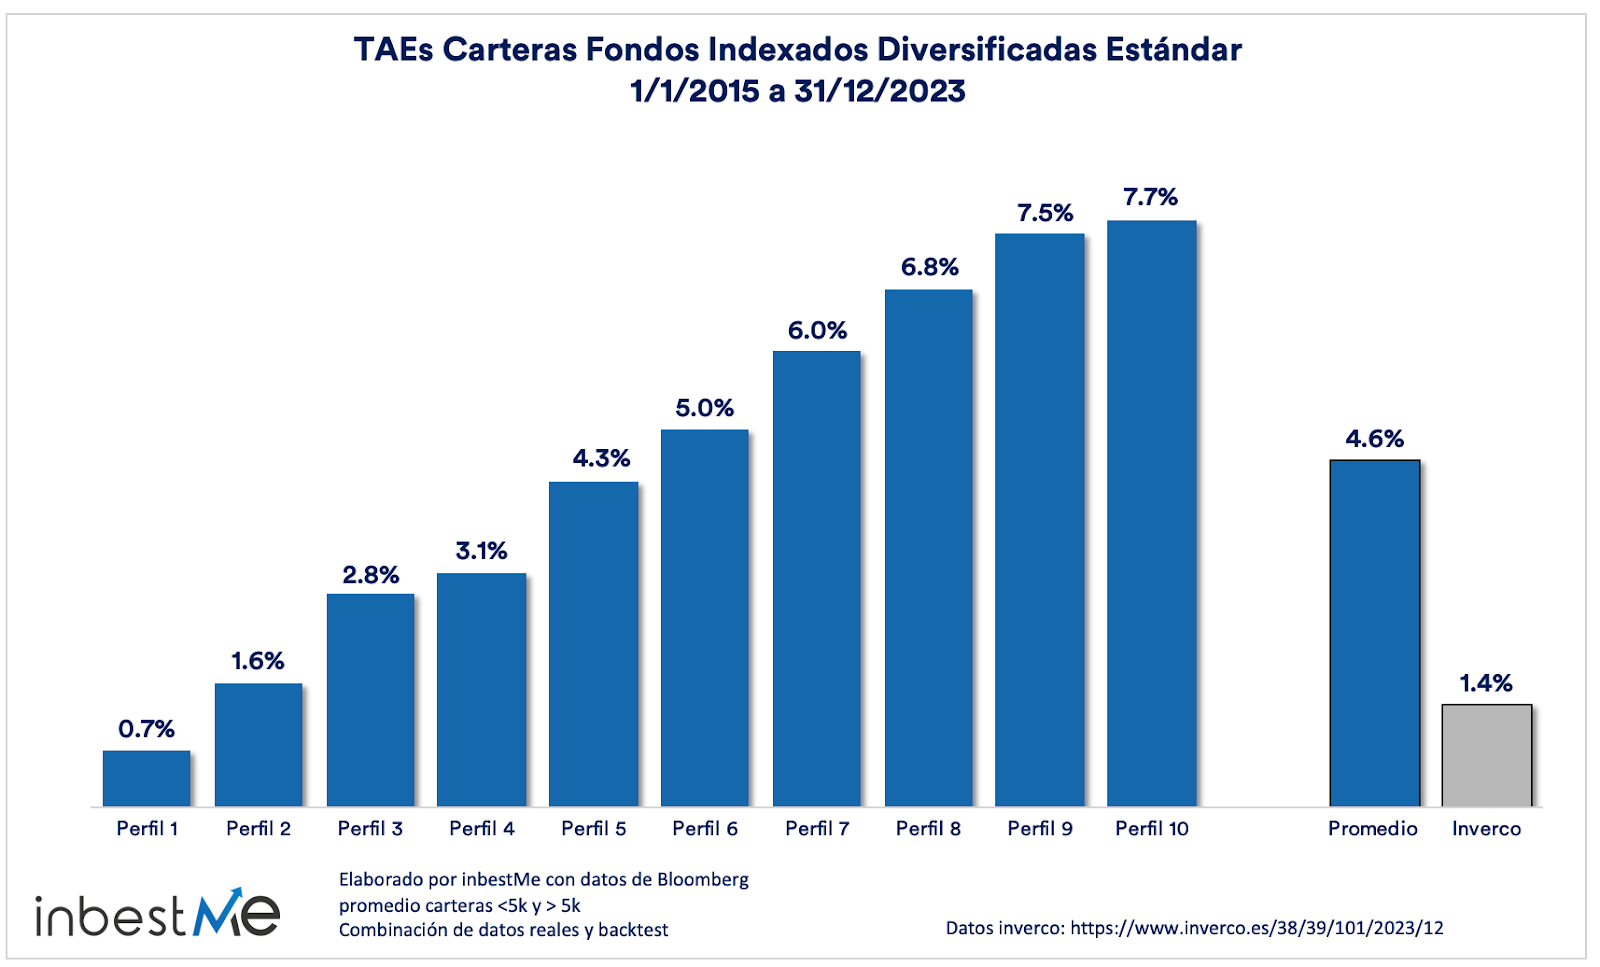
As can be seen from the chart above, our standard index mutual fund portfolios show an average annualized return (AAR) of 4.6%. This return is 3.3 percentage points higher, or 3.4 times the weighted average return of mutual funds in Spain, according to Inverco data.
TAEs of actual vs. expected diversified index mutual fund portfolios
It makes little sense to review expected versus actual returns, especially over a one-year period.
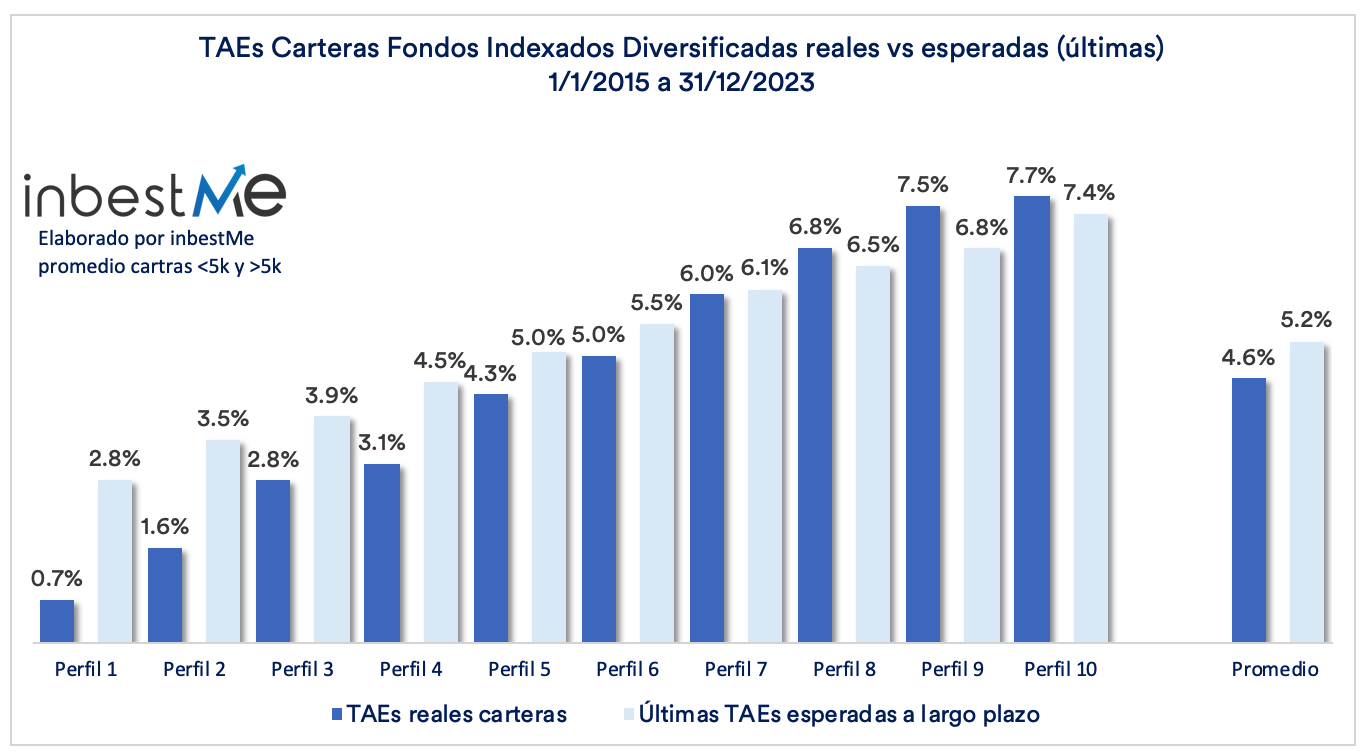
It may make more sense to look at it cumulatively over a longer period, as we do in the chart above. As we can see, the excellent returns in 2023 have helped the average real returns of our portfolios now at 4.6% to be close to the latest expected average returns of 5.2% despite the fact that in this period we have suffered two bear markets in a short time (Covid19 in 2020 and Inflation Crisis/Ukraine in 2022).
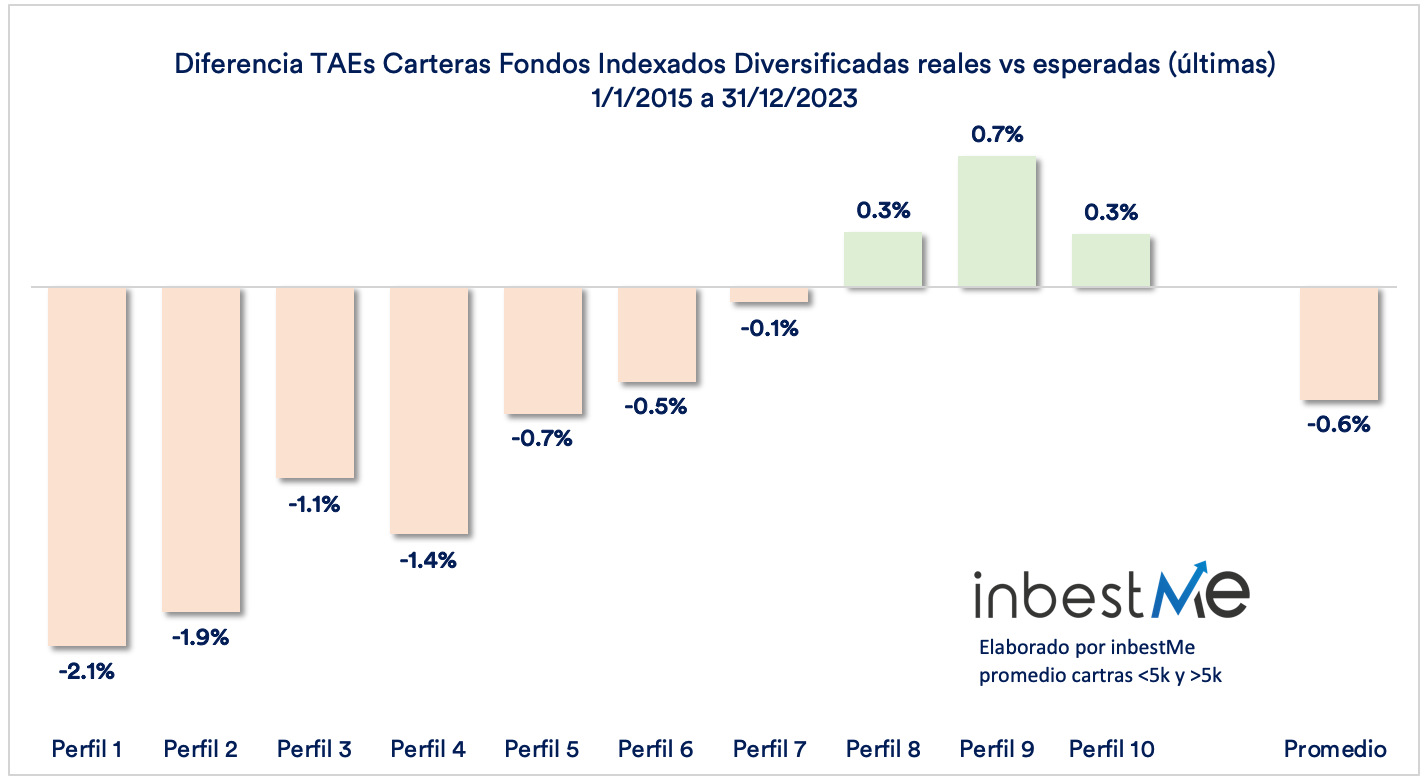
As can be seen, this difference, which was very wide at the end of 2022 (-2.1 percentage points), is now only -0.6% on average. As we can clearly see in the graph above reflecting the differences, in profiles 7 to 10 they have fully recovered or are even above, while in profiles 1 to 6 they are still below. This is due to two factors: first because, as we have said above, fixed income has not yet recovered the falls of 2022 and second because in the last review we raised the expected returns precisely in these lower profiles. It is to be expected that due to the effect of the reversion to the mean, these will continue to recover in the coming months or years, especially if interest rate cuts are confirmed. The fact that US stock markets have recently been at record highs may help on the equity side.
We will now proceed with a more detailed analysis, comparing each of our portfolio profiles with its corresponding category of mutual funds in Spain, as published by Inverco.
Detailed comparison of the performance of our portfolios against the different categories of mutual funds according to Inverco.
In the graph below we see a comparison of all the profiles of our portfolios compared to the different categories of Inverco’s statistics of mutual funds in Spain, so that we can compare our portfolios with mutual funds that cover the same asset class and have a similar risk profile.
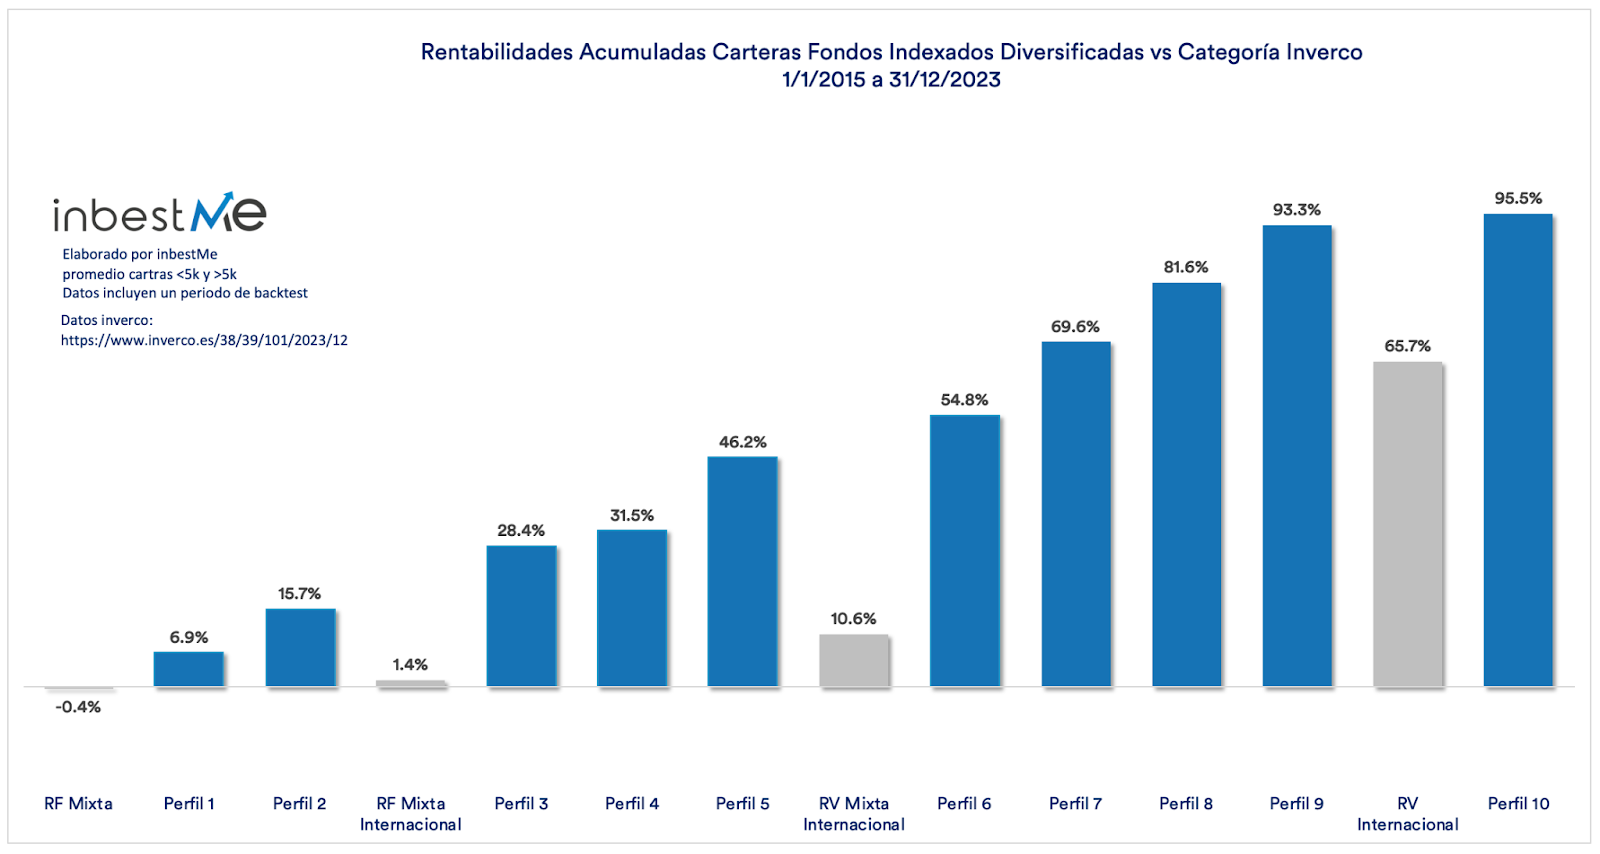
We can quickly observe in the graph above that in all categories the inbestMe portfolios have accumulated a much higher return. To illustrate this, if we take profile 7 (average profile) an investor who had invested €100,000 in it would have accumulated €169,600 while in the corresponding Mixed Equity category he would have accumulated only €110,600: a very significant difference of €59,000.
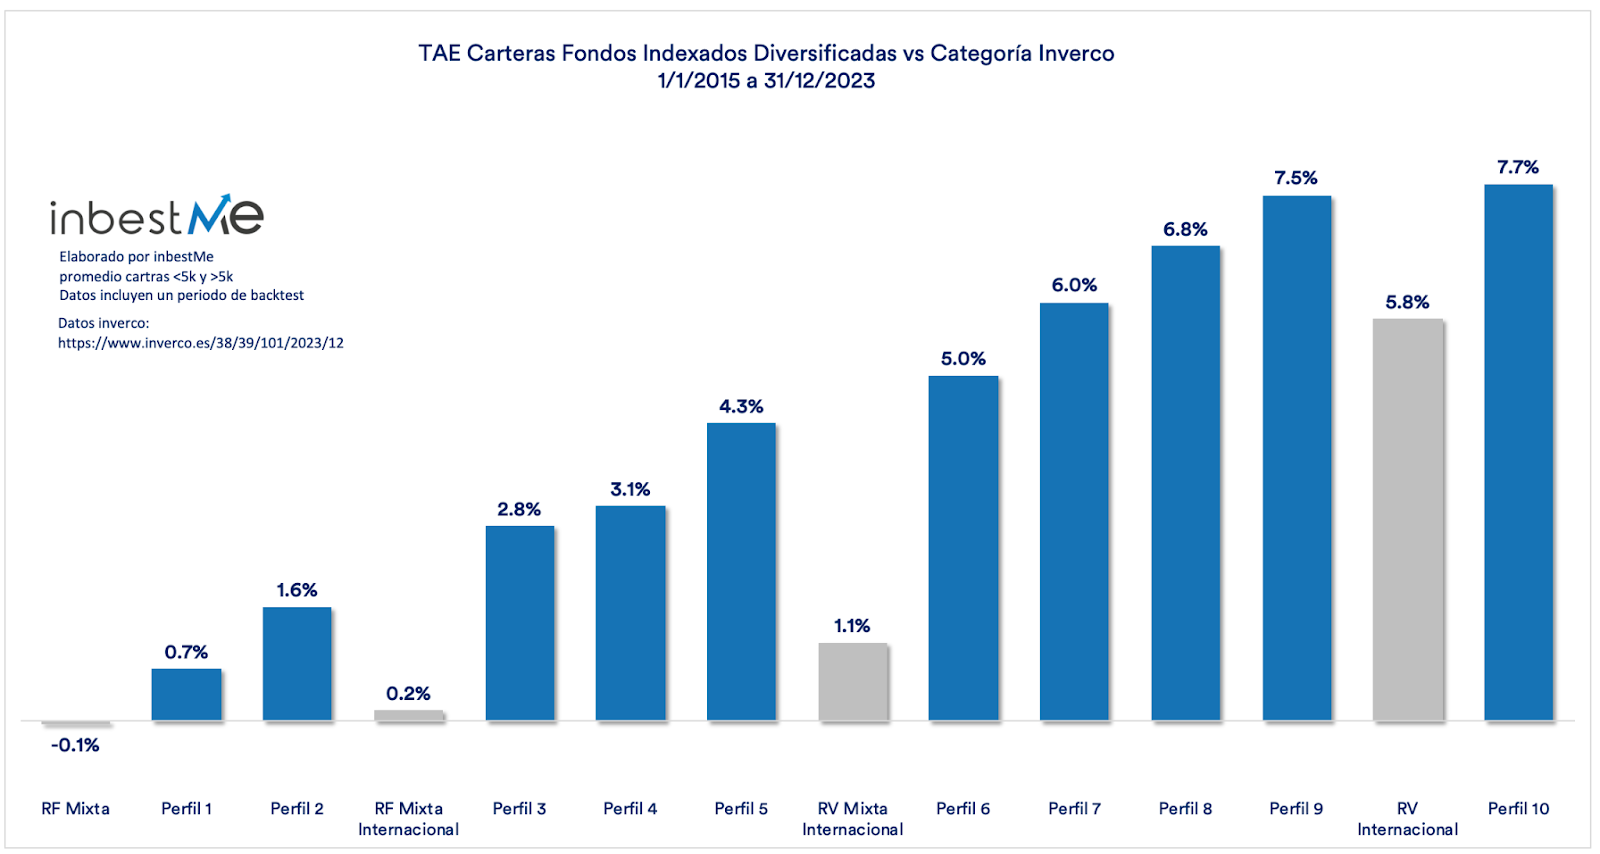
In the graph above we can again see these differences converted to annualized returns (APRs), which range from 0.7% for profile 0 to 7.7% for profile 10, and again always exceed their corresponding category.
The table below shows in more detail that the average annualized return (APR) of our portfolios, which is 4.6%, is 3.5 percentage points higher, or 4.3 times the average of the corresponding categories, according to Inverco statistics, which, only for similar categories, drops to 1.1%.
While it is true that past performance is no guarantee of future results, it is also true that we are almost systematically reporting that the average APR of our portfolios is almost always around 3 percentage points higher -this year specifically 3.5 percentage points- than the weighted average return of mutual funds in Spain according to Inverco. These differences can be seen graphically in the chart below.
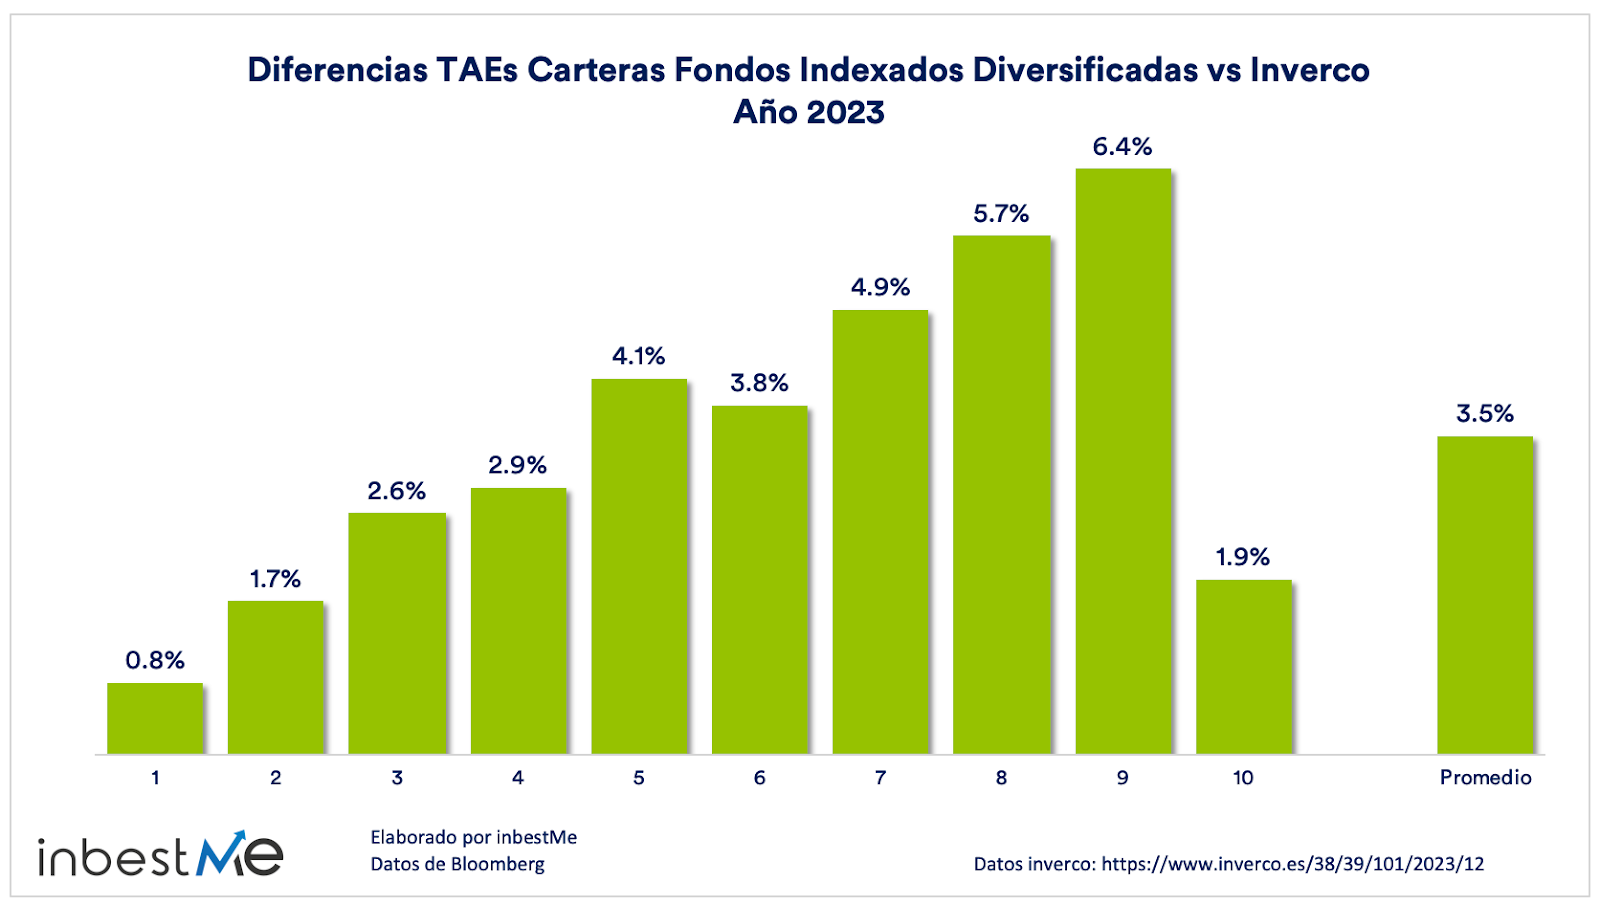
The largest differences are observed in profiles ranging from 5 to 9, where the gap in profitability reaches an average of 5 percentage points, which is equivalent to a multiple of more than ten times. It is in these profiles where the majority of our clients who contract Diversified Index Fund Portfolios are concentrated.
You can find more details about other portfolios in the following list:
- Pension plan portfolio returns at the end of 2023
- Performance of SRI index fund portfolios at year-end 2023
- Performance of Dynamic ETF portfolios at year-end 2023
- Performance of the Savings portfolios at year-end 2023
- Bond Portfolio Performance at year-end 2023