Although the majority of analysts had a negative view and forecasted a recession, the first half of 2023 proved to be a favourable period for financial markets. This came after a horrible 2022 in which stocks and bonds fell together. In this article, we bring you the portfolio returns as of the end of June 2023.
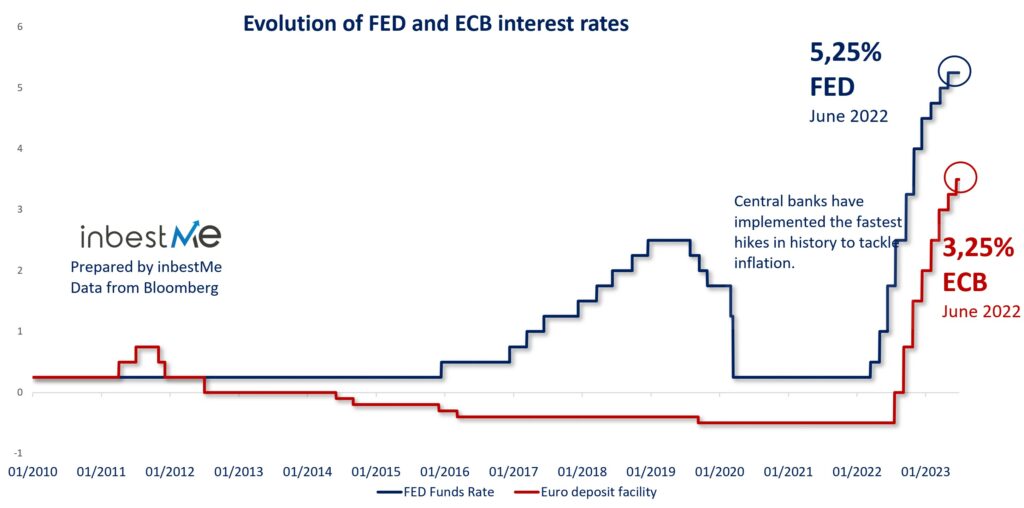
It was surprising how the economy has withstood such large interest rates hikes decided by central banks to contain inflation. In the EE.UU. interest rates were raised by a total of 5%, and they are now above the level of the inflation (see graph below). In Europe, they were raised by a total of 4%. Both the FED and the ECB forecast new rate hikes during the summer.
One of the factors that made the economy so resilient to such an aggressive monetary policy restriction is the fact that services today constitute a much larger portion of the economy than in the past. Services, being less capital intensive than manufacturing, make the economy less sensitive to interest rates.
Also, especially in the US, households came out of the pandemic with more savings (because of lower expenses and more support by the government) and this is still helping to sustain private consumption.
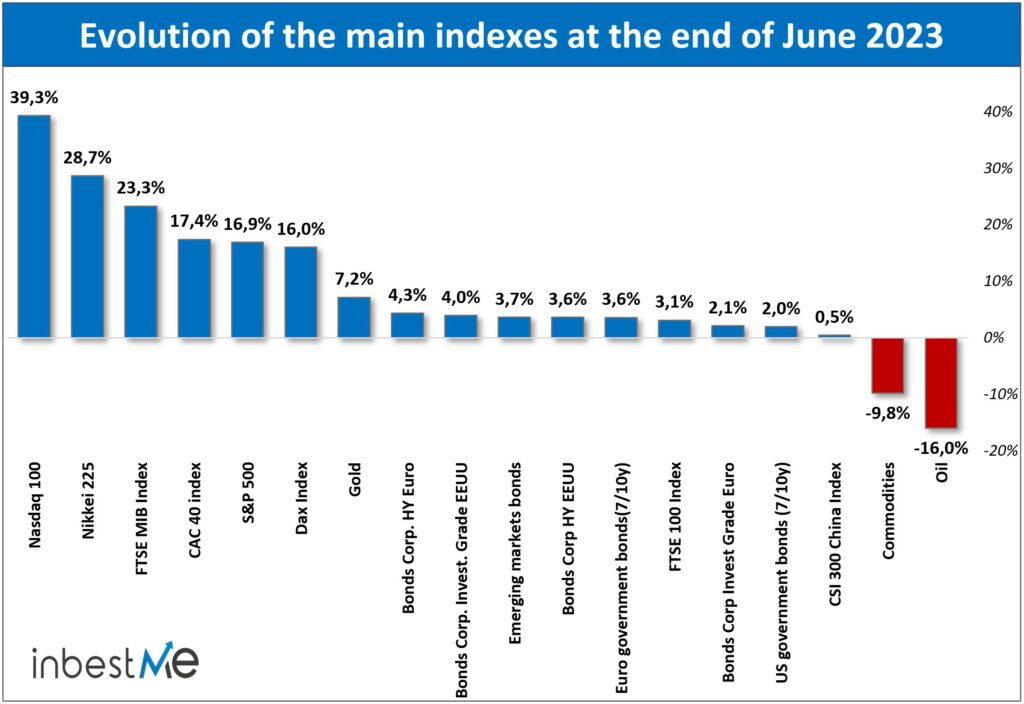
Stocks indices were driven higher by the technology sector which received a big boost by the explosion of the theme of artificial intelligence. EEUU indices restarted to overperform thanks to the higher weight of technology.
On the contrary, commodities, the only asset class that had a positive performance in 2022, did not perform well in 2023 also due to the reopening in China that proved to be less strong than expected and the country continued to be affected by stagnant consumption and by a deep crisis of the real estate sector. This caused an underperformance of emerging markets equity indices in which China has a heavy weight.
Performance of the Indexed Funds portfolios at the end of June 2023
The performance of our two main lines of long term portfolios (strategic Index funds and Strategic ETF) was clearly positive during this first half of the year.
Although we will talk about them in passing, you can see an additional and complementary report on:
- Pension plan portfolio returns at the end of June 2023
- Returns on SRI indexed portfolios at the end of June 2023
- Value ETF portfolios returns at the end of June 2023
- Performance of the dollar portfolios at the end of 2023
- Performance of Dynamic ETF portfolios at year-end 2023
Much of the contribution to the performance came from the equity part of the portfolios, except from the ”Renta Variable Immobiliaria” that continued to be hit by the move higher in interest rates.
Some underperformance also for the small cap that could not keep the pace of the megacaps of the technology sector. Small caps are usually more cyclical, meaning that their behavior is more closely tied to the health of the economy. They suffer from the expectations of an economic slowdown, but are among the first to recover once interest rates fall and the economy seem to be bottoming.
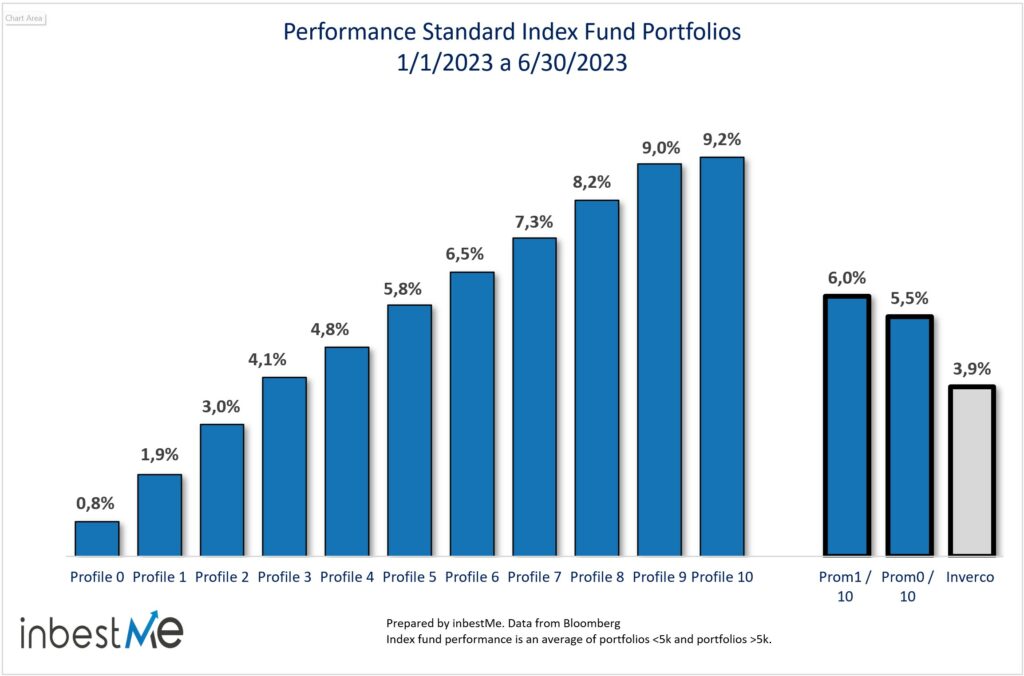
The average return of index fund portfolios was 6% or 2.1 percentage points higher than the weighted average return of mutual funds in Spain, according to Inverco statistics.
Including profile 0, the average of our portfolios is 5.5%.
As can be seen in the graph, returns have ranged from 1.9% for profile 1 to 9.2% for profile 10, well above what was expected for half a year. Profile 0 has obtained a 0.8% return: remember that profile 0 is a portfolio made up solely of bonds that have regained attractiveness after the falls of the previous year.
ETF portfolio returns at the end of June 2023
The only commodity that we hold in portfolio, which is gold, did relatively well compared to other commodities despite the fact that real interest rates went higher (gold and real interest rates usually move in opposite directions). This good performance of gold is partly attributable to the massive purchases by central banks on the back of increased geopolitical tensions. Those central banks of the countries that are not aligned with the US and Europe, now want to diversify their reserves away from dollar and euro and have been big buyers of gold.
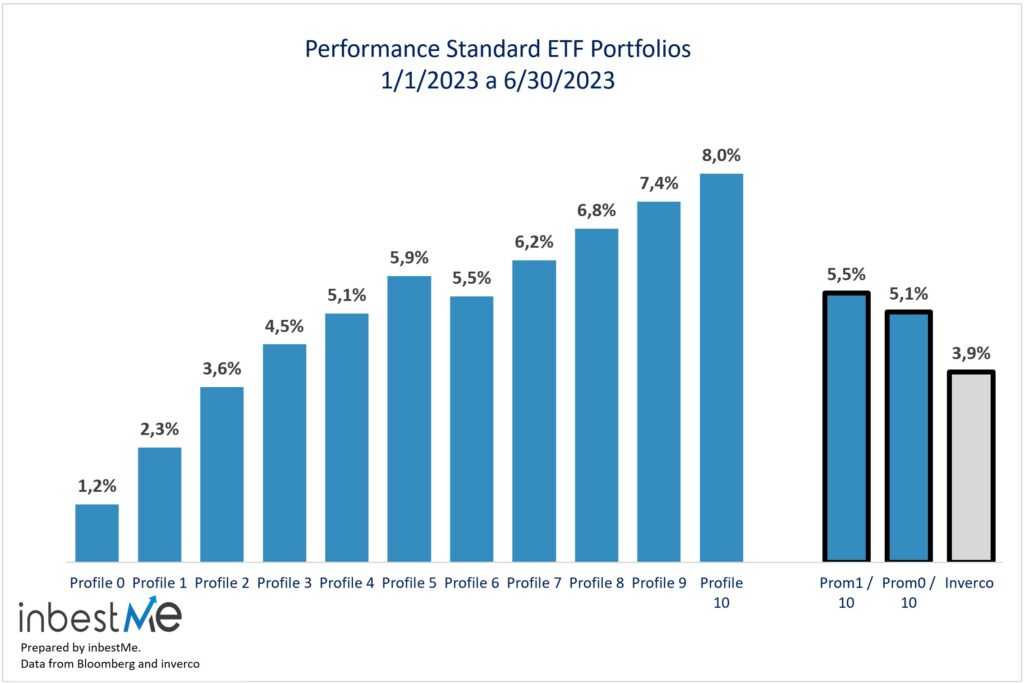
The average return of Standard ETF portfolios was 5.5% (profile 1 to 10) or 1.6 percentage points higher than the weighted average return of mutual funds in Spain according to Inverco statistics.
As can be seen in the graph, returns have ranged from 2.3% for profile 1 to 8% for profile 10, well above what was expected for half a year. Profile 0 has obtained a 1.2% return: remember that profile 0 is a portfolio consisting only of bonds that have regained attractiveness after the falls of the previous year. Considering profile 0, the average is 5.1%.

Comparative returns of the different portfolios at the end of June 2023
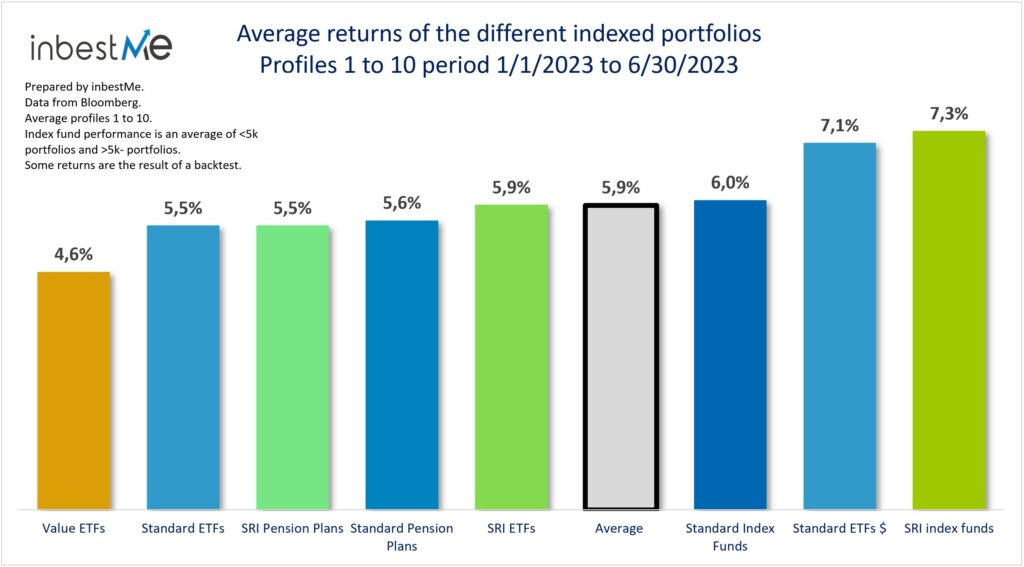
As for the line of portfolios other than Standard, the graph below shows the average return of each portfolio. The average return (profile 1 to 10) of all the indexed portfolios is 5.9% from 1/1/2023 to 6/30/2023, or 2 percentage points higher than the weighted average of the mutual funds d
Interesting to note the good performance of SRI index fund portfolios, reaching 7.3%. inbestMe was the first entity to introduce SRI indexed portfolios in 2018. SRI indexes underperformed during 2022 due to the lower weight of energy in their composition and the higher weight of technology compared to conventional indexes. So basically the underperformance in 2022 was due to their sector composition. The exact opposite is happening in 2023, with technology doing very well and energy underperforming. This is what has produced an extra return in the SRI indexes which we have also highlighted in the specific report to the returns of SRI indexed portfolios at the end of June 2023.
The dollar ETF portfolios with an average of 7.1% also stand out by benefiting from higher dollar bond yields and gains due to currency exposure thanks to the falling dollar. In the report on the performance of dollar portfolios at the end of June 2023, we will see that they have historically outperformed. Let us remember that in order to obtain a return in dollars you have to be exposed to the dollar, in other words, a European cannot obtain the same return in dollars as measured in Euros. This currency movement has not affected the Euro portfolios, as our Euro portfolios are partially hedged to the dollar in order to reduce the exposure to what would be a loss when the dollar depreciates.
Although we have talked about them in passing, you can see an additional and complementary report on:
- Pension plan portfolio returns at the end of June 2023
- Returns on SRI indexed portfolios at the end of June 2023
- Value ETF portfolios returns at the end of June 2023
- Performance of the dollar portfolios at the end of 2023
- Performance of Dynamic portfolios at year-end 2023
The other portfolios are close to the average of 5.9%. Slightly further away from the average this year are the value ETF portfolios (4.6%), which we analyze in detail in the report on the performance of the value ETF portfolios at the end of June 2023.
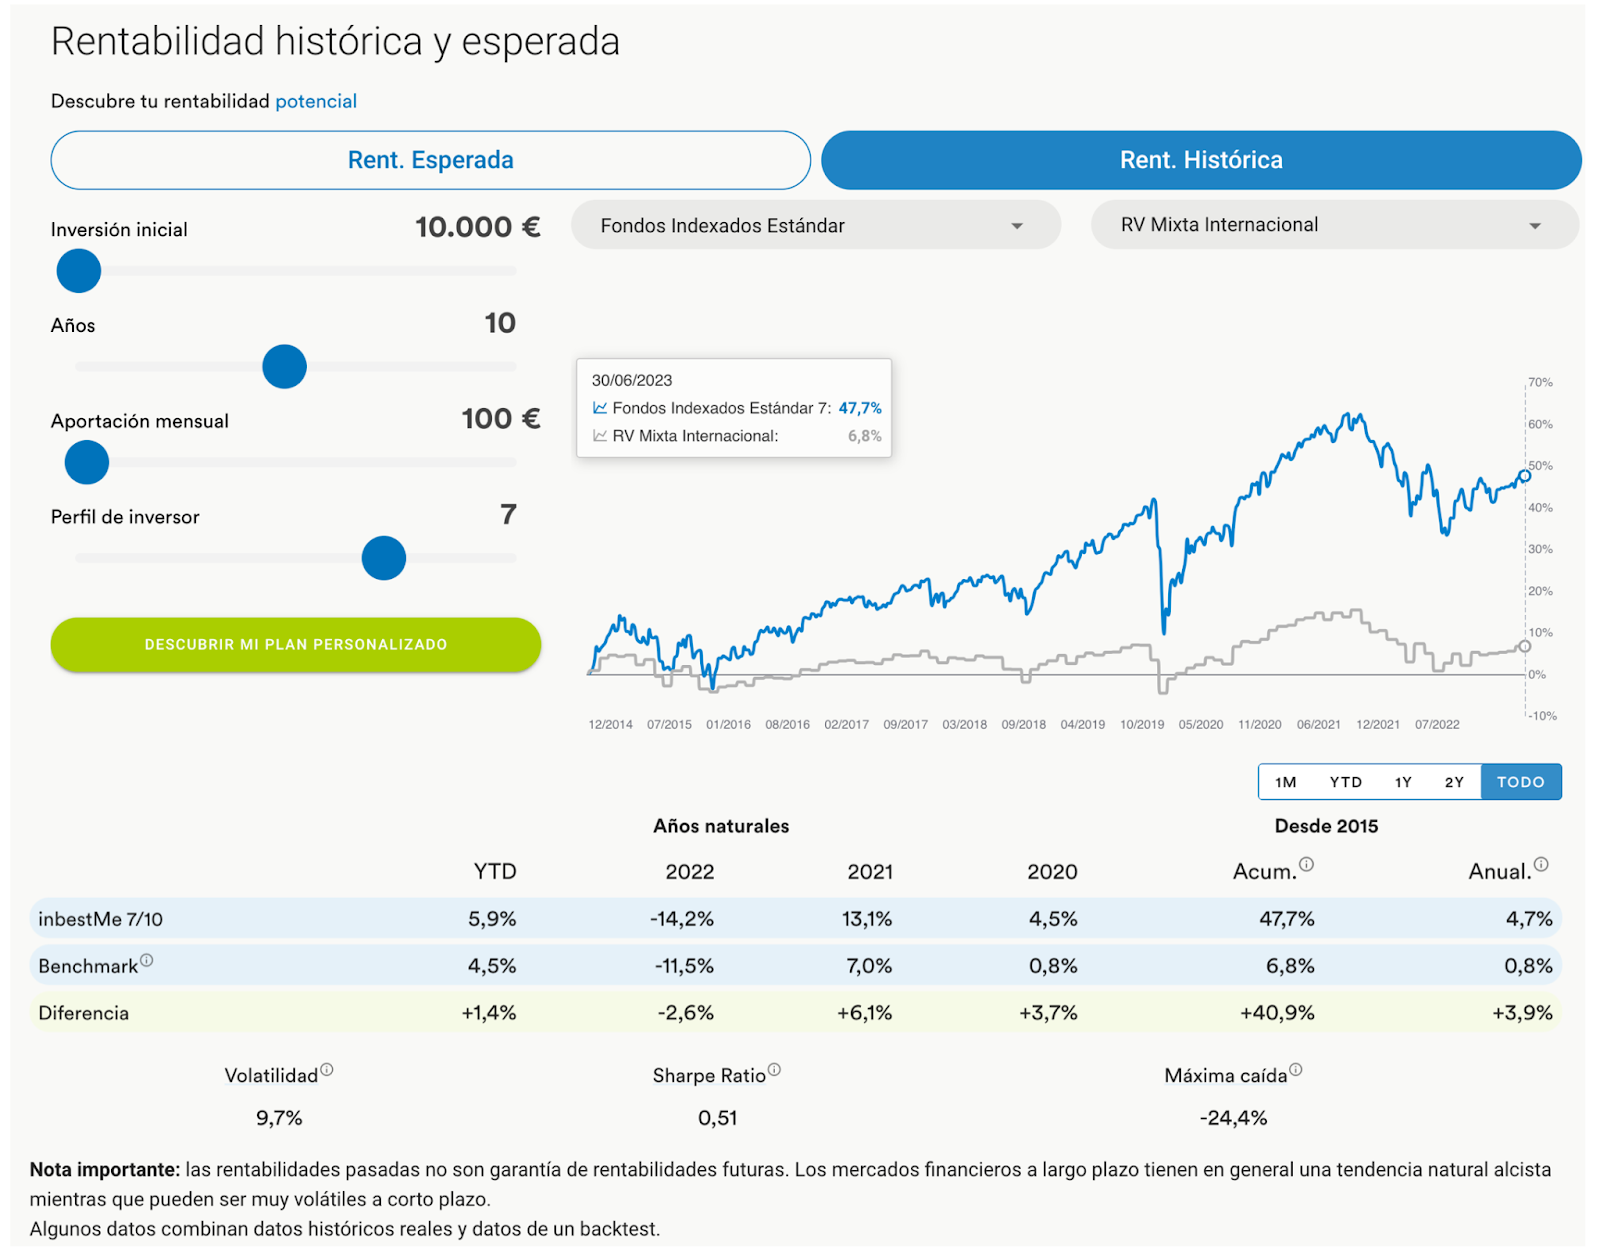
We remind you that if you want to see more details about the performance of our portfolios (in this period or in others and for all risk profiles) you can consult the inbestMe performance page on our website where you will find comparisons with other benchmarks and risk ratios such as volatility, Sharpe Ratio and drawdown and for the different risk profiles and periods.
Performance of Index Fund portfolios since their inception
Our portfolios exist since jan 2015. They have gone through some relevant stress testing during this period. The dynamics that we saw in the economy and in financial markets after the pandemic hit were unprecedented.
The portfolios are anyway built with a long term approach in mind so, despite periodic setbacks that are the normality in financial markets rather than the exception, they need to show resilience and grow over the long term.
So, despite the heavy tests of the last period, the portfolios are all showing a positive return since inception. The only exception is portfolio zero, that is composed only of bonds, that was victim of the massive increase in interest rates of 2022 and is showing a small loss.
Since inception, inbestMe portfolios are showing an average total return of 32.8% as far as ETF portfolios are concerned and of 32.9% as far as Index Funds portfolios are concerned.
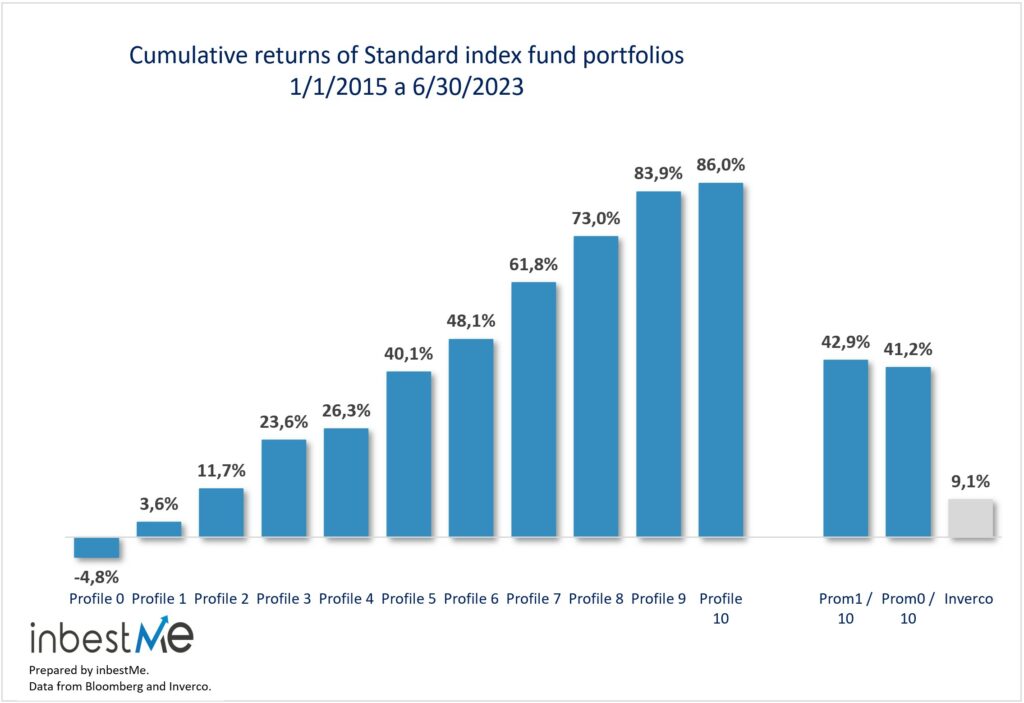
Since their conception, inbestMe’s portfolios of index funds show an average cumulative return of 42.9% (profile 1 to 10) or 33.8 percentage points or 4.7 times more than the average cumulative return of mutual funds in Spain according to Inverco.
Cumulative returns range from 3.6% for profile 1 to 86% for profile 10.
Profile 0, which is a bond-only portfolio, is the only one in negative due to the poor performance of fixed income in 2022, which has considerably increased its return expectations from 2023 onwards along with the lower profiles.
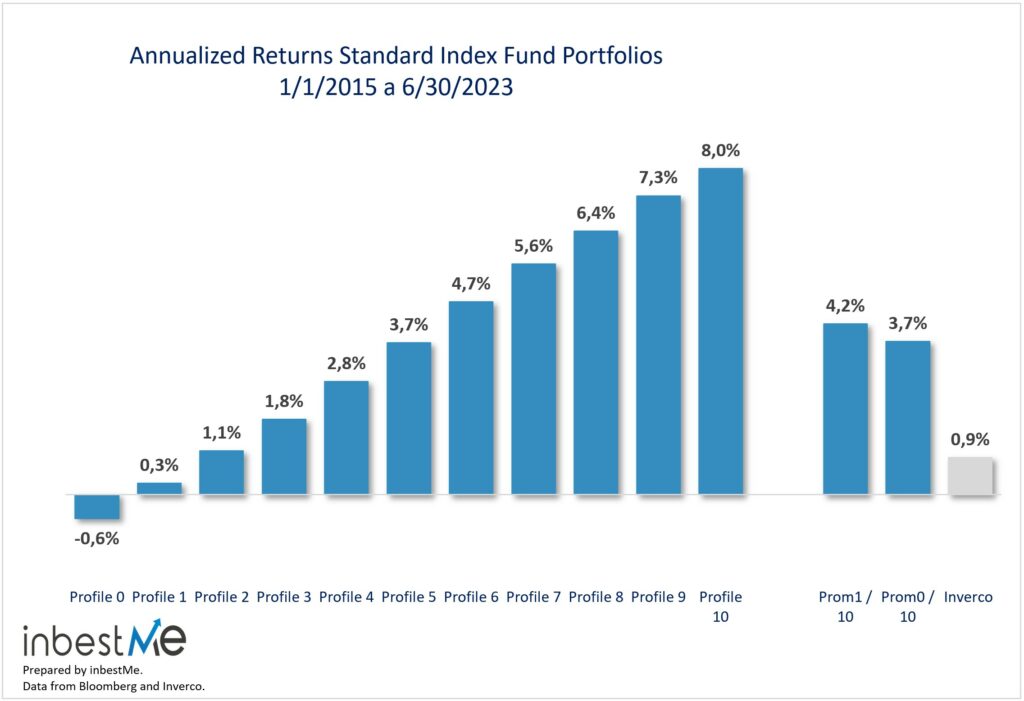
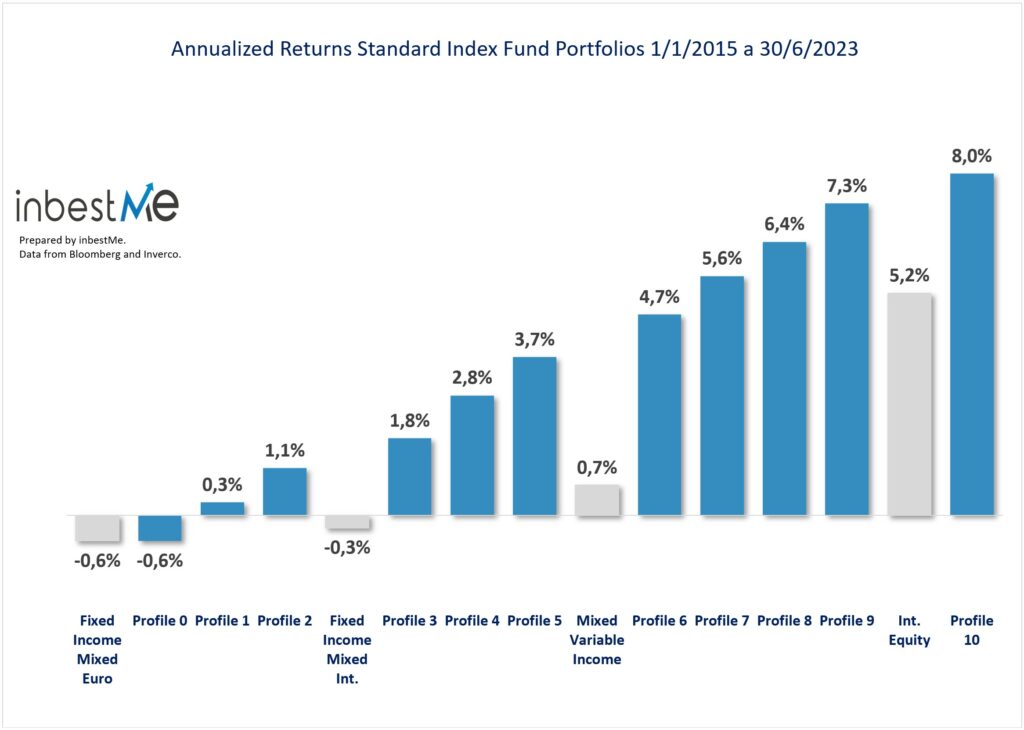
inbestMe’s Standard index fund portfolios obtain an average annualized return (AER) of 4.2% (profile 1 to 10), or 3.3 percentage points or 4 times more than the average weighted return of mutual funds in Spain, according to Inverco statistics.
Annualized returns range from 0.3% for profile 1 to 8% for profile 10, bringing them back closer to expected long-term returns.
Profile 0 which is a bond-only portfolio is the only one to earn an annualized return due to the poor performance of fixed income in 2022, which has increased its return expectation for the next few years considerably to 2.2%.
Below, we analyze the performance of our portfolios in more detail, comparing them with the most representative category of mutual funds in Spain.

Comparación detallada del comportamiento de nuestras carteras frente a las diferentes categorías de los fondos de inversión según Inverco
In the graph below we see a comparison of all the profiles of our portfolios compared to the different categories of Inverco’s statistics of mutual funds in Spain, so that we can compare our portfolios with mutual funds that cover the same asset class and have a similar risk profile.
Low risk profiles (0 and 1 ) are benchmarked against Renta Fija mixta nmutual funds, profiles 2 and 3 are compared with Renta Fija Mixta international, average risk profiles from 4 to 8 are compared with renta variable mixta international and the most risky portfolios are compared with RV international.
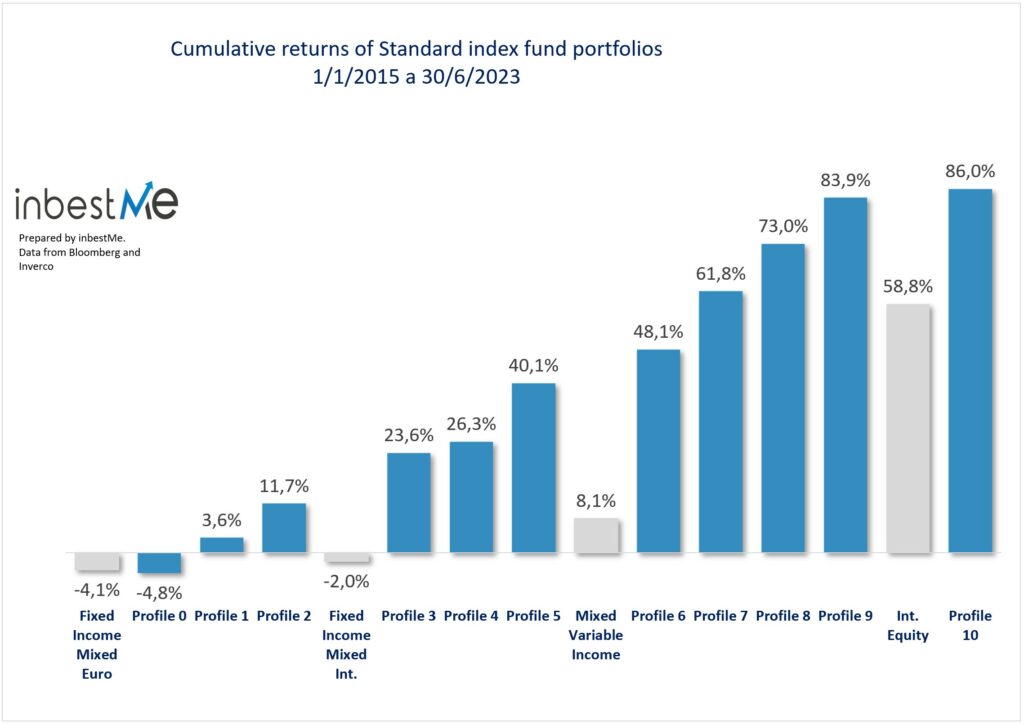
As can be easily observed, the cumulative performance of the inbestMe portfolios far exceeds the corresponding benchmark category of mutual funds in Spain according to Inverco and more specifically:
- Profile 1 (+3.6%) and 2 (11.7%) clearly outperform the -4.1% obtained by the Euro Mixed Fixed Income category. Profile 0 was slightly below with -4.8%.
- Profiles 3 (+23.6%), profile 4 (+26.3%) and profile 5 (+40.1%) clearly exceed the -2% of the International Mixed Fixed Income category, i.e., 21, 25 and 38 percentage points higher.
- Profiles 6 (+48.1%), profile 7 (+61.8%), profile 8 (+73%) and profile 9 (+83.9%) outperform the Mixed Equity category by 40, 53, 65 and 75 percentage points, which remains at 8.1%.
- Profile 10 accumulated a return of 86%, outperforming the international equity category by more than 27 percentage points (58.8%).
If we measure these differences by category (see table below) we see how the annualized AER returns of our portfolios (profile 1 to 10) is 3.6 percentage points higher than the average of the corresponding categories of the Inverco statistics.
And if we measure these differences by category (see table below) we see how the annualized AER returns of our portfolios (profile 1 to 10) is 3.6 percentage points higher than the average of the corresponding categories of the inverco statistics.
If profile 0 is included, the difference is 3.3 percentage points.
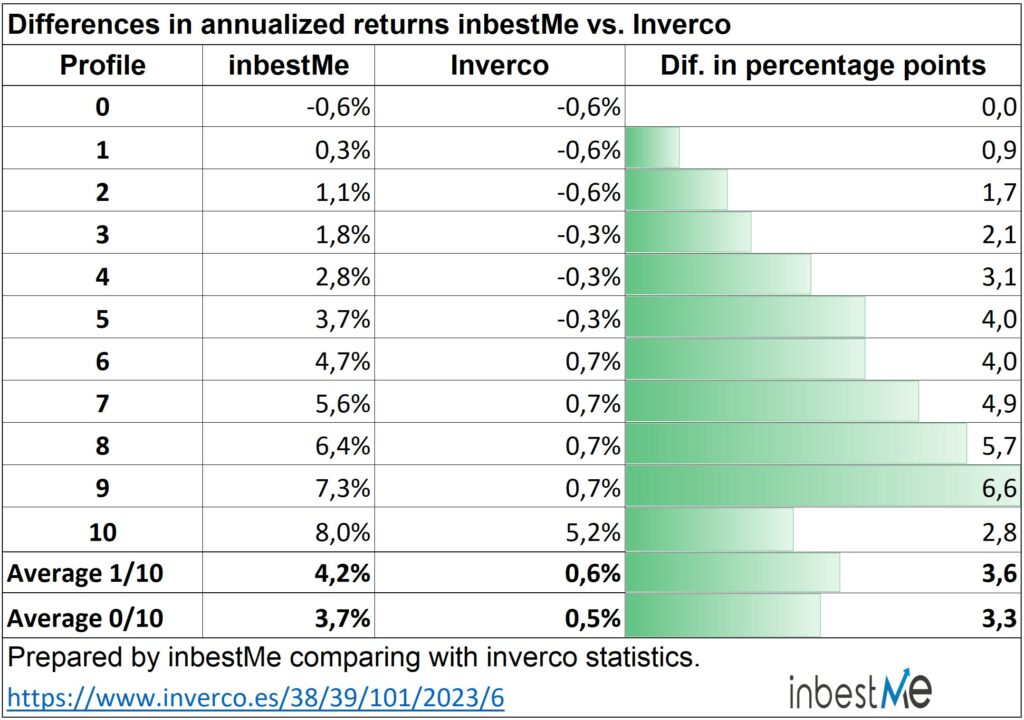
Although past performance is no guarantee of future returns, it is a statistical fact that consistently our portfolios’ APRs are almost always around 3 percentage points above the average weighted return of mutual funds in Spain.
The most significant differences are in profiles 5 to 8, where this difference reaches 4.7 percentage points on average, and where most of our customers are concentrated.
In detail, the differences by category are as follows:
- Profile 1 (+0.3%) and Profile 2 (1.1%) outperformed the Euro Fixed Income Mixed category by 0.9 and 1.7 points, respectively, with an APR of -0.6%, the same as Profile 0.
- Profile 3 (+1.8%), Profile 4 (+2.8%) and Profile 5 (+3.7%) outperformed by 2.1, 3.1 and 4 points, respectively, the fixed income mixed category.
- Profile 6 (+4.7%), Profile 5 (+5.6%), Profile 8 (+6.4%) and Profile 9 (+7.3%) outperformed the Mixed Equity category by 4, 4.9, 5.7 and 6.6 points, respectively.
- Profile 10 (+8%) exceeds the APR of the International Equity category by 2.8 percentage points.