As we already mentioned when we presented the new Savings Portfolio, it has a known yield (annualized return) with a very high degree of confidence, the one we publish at all times, but it is a variable yield depending on the official interest rates in the Euro zone and the official rates of the FED in the USA. In this post, we show how to calculate the variable yield of the Savings Portfolio.
Recently, we announced an increase in the yields of Savings Portfolios:
- The Dollar Savings Portfolio at 4.30%.
- The Euro Savings Portfolio at 2.40%.
In this link, you can consult the updated yield of the Savings Portfolios.
Estimated calculation of variable yields for Savings Portfolios
The starting point for calculating the estimated yield is to know the official central bank rates:
At the time of writing this article and after recent rises (around 12/15/2022) these are:
- FED funds rates (low level) 4.25%.
- Deposit facility or €STR: 2.00%.
These would be the Benchmarks of the monetary funds we selected.
But before we can make the calculation, we must take into account other factors:
- From our experience with these funds, we know that they manage to obtain a gross one-year yield or annualized return close to, but around, say, 0.10% below.
- The average TER of the money market funds we use is around 0.13% (example ECB/EURO).
- The maximum additional savings portfolio costs are:
- 0.25% inbestMe’s management fee (we take the maximum fee).
- 0.11% custody fee (or trading/custody in the case of ETFs).
| Concept | FED/USD | BCE/EURO* |
| Official rate 15/12 (1) | 4,25% | 2,00% |
| -Estimated deviation (2) | -0,10% | -0,10% |
| -Bid/Ask spread (3) | -0,05% | |
| Gross YIELD Estimated Eff. (4) | 4,10% | 1,90% |
| -TER funds (5) | -0,13% | -0,13% |
| YIELD net (6) | 3,96% | 1,77% |
| -Management fee (7) | -0,25% | -0,25% |
| -Custody/Trading (8) | -0,11% | -0,11% |
| Variable YIELD est.(9) | 3,60% | 1,41% |
| YIELD var. published (10) | 3,60% | 1,40% |
In the table above, we can see how we arrive at the estimated calculation of the recently published variable yields. As we can see, we tend to publish a rounded yield (at 5bp) and in general somewhat lower than estimated, especially after changes in official rates.
One of the factors conditioning the calculation is the estimated deviation between the return actually obtained by the money market funds and the interest rate. The investment committee is constantly monitoring both the selected funds and other candidate funds to optimize this difference and maximize the return of the Savings Portfolio. In our experience this spread can be tighter, but each time there has been a rate change this spread can be higher for a few days and then narrow.
This is monitored on a weekly basis, as we will see below.
This is the calculation for the Euro money market funds savings portfolio. For simplicity, we have not included the calculation for the ETF account. The concepts would be the same as those involved in the “FED/USD” column but adapted to the ECB/EURO. The resulting variable yield for the Euro/ETFs version is very similar to that of the EURO money market funds.
Actual weekly calculation of variable yields
inbestMe’s investment committee monitors the money market funds and ETFs we use on a weekly basis to check that the actual yields correspond to the estimates. In case the actual estimate varies by more than 10bp (0.10%) up or down during a month, we would make an additional communication to our clients.
| Concept | FED/USD | BCE/EURO |
| Effective weighted average effective interest rate (11) | 4,08% | 1,95% |
| -TER funds (5) | -0,11% | -0,13% |
| -Bid/Ask spread (3) | -0,05% | |
| YIELD net (6) | 3,92% | 1,82% |
| -Management fee (7) | -0,25% | -0,25% |
| -Custody/Trading (8) | -0,11% | -0,11% |
| Effective variable YIELD (12) | 3,56% | 1,46% |
| YIELD var.published (10) | 3,60% | 1,40% |
| Difference effective-published (13) | -0,04% | +0,06% |
In order to make this communication possible, the inbestMe investment committee has provided the following mechanism.
The calculation is done again, but instead of starting from the official rates, which is the only thing that can vary from the estimated calculation, we do it by starting from and weighting the effective published yield of the funds at the end of each week.
In the table above, we have simulated one of these weekly calculations with two possible scenarios:
- For the FED/USD case, the performance is finally somewhat lower than expected, resulting in an effective variable yield of 3.56% instead of 3.60% due to the fact that the weighted effective yield of the funds is 2bp lower (in the example 4.08% instead of 4.10%).
- For the ECB/Euro case, the performance is finally somewhat higher than expected, resulting in an effective variable yield of 1.46% instead of 1.40% due to the fact that the funds’ effective weighted yield is 5bp higher (in the example 1.95% instead of 1.90%).
This calculation, as we said, is reviewed every week. Apart from the weekly calculation, we also compute the monthly calculation. In the case that these variations are confirmed in a whole month, is when we would consider an extra publication to our clients, in the case that these exceed 0.10% up or down. For example, in both cases we would not make any extra publication, we would simply adjust the actual yield in the client area.

Expected return and variable yield
At inbestMe we use two concepts when we talk about the performance of our portfolios.
For investment accounts, whether index funds, ETFs or pension plans, we use the terminology of expected returns and show the variability of these expected returns.
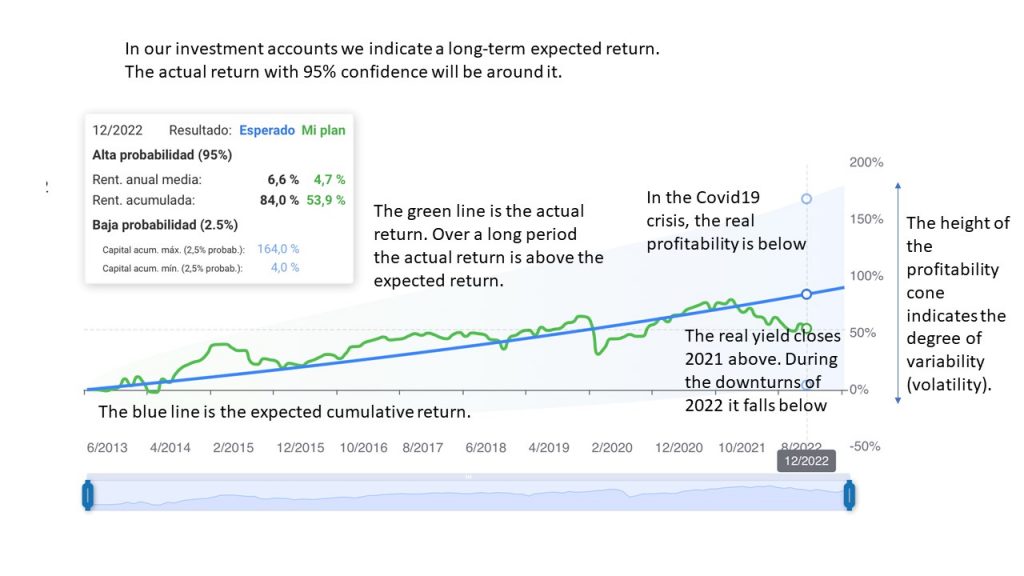
This variability is linked to the historical volatility of expected returns. The higher the risk exposure (height of the cone on the graph) the higher the volatility, i.e. the higher the profile (our profiles range from 0 to 10). The expected return is actually the expected “average” of the portfolio returns over the long term. By definition, it will be very unlikely that in one year we will see that return in our account. Rather, it will be over time that we will see that return consolidate (with a 95% confidence level). See more details in the chart above.
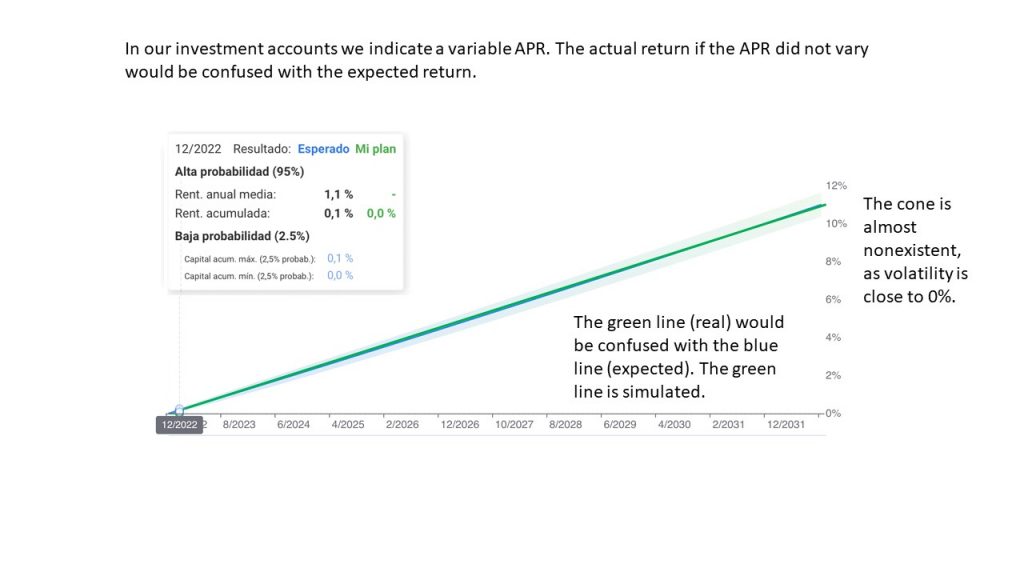
For Savings Portfolios we use the terminology of variable yield. This yield, if the official rates do not change, will not vary. But in the environment we are in right now, with forecasts of increases, it is likely to vary. If interest rates do not change in a year, it is certain for this year with a degree of confidence close to 100%. That is the big difference: the lack of volatility of the monetary funds we use makes it possible to “fix” a yield with a very high degree of certainty, and only subject to the minimum adjustments mentioned in the previous paragraphs.
Let’s take an example, if a client invests on 1/1/2023 100,000 euros in a savings portfolio with the currently known yield (1.40% 21/12/2022) he would obtain 101,400 euros (100,000 + (100,000X 1.4%)) with a degree of confidence of 99% (let’s say 50 euros up or down).
As the yield will change if interest rates rise or fall, we call it variable yield: as many variations as the ECB changes the official rates. Continuing with the previous example, if interest rates were to rise by another 0.50%, for simplicity’s sake in mid 2023 (30/6/2023) and the new YIELD calculated (following the previous examples) would be 1.90%, the same investor as before would obtain 101,650 euros (100,000 + (100,000 X 1.4%/2)) + (100,000 X 1.9% /2) with an average resulting YIELD of 1.65%.
Consult here if you are interested in knowing the VARIABLE YIELD ESTIMATE OF THE SAVINGS PORTFOLIO IN EUROS.
Consult here if you are interested in knowing the VARIABLE YIELD ESTIMATE OF THE SAVINGS PORTFOLIO IN DOLLARS.
Continuing with the analogy, in a way, in both analyses we would be estimating the expected 3-year return of the Savings Portfolios with the projection of the evolution of interest rates.
Annex I: more details on the concepts used in the calculations
- Official rate: this is the official interest rate set by central banks. The Federal Reserve System, often referred to as the FED or “the Federal Reserve”, is the central bank of the United States and sets the official rates for the U.S. dollar. The European Central Bank (ECB) sets the official rates for the Euro.
- Estimated deviation: this is the difference that we estimate may exist between the returns that the money market funds or ETFs will generate and the official rates. It would be similar to the tracking difference in an index fund. We do not use this concept because, strictly speaking, the funds or ETFs that we use in Savings Portfolios are not indexed. Moreover, this would be the additional difference to be added to the TER (5) to match the real yield with the official interest rate (1).
- Bid/Ask spread: when buying and selling ETFs (as with any stock) there is a difference between the bid price and the ask price. This difference can reduce profitability.
- Estimated effective gross yield: this would be the calculation resulting from (1)-(2)-(3) or the estimated effective gross (before expenses) yield.
- TER funds: Total Expense Ratio (TER) is the cost of money market funds or ETFs. (5) + (2) would be comparable to the “total cost of an index fund” if they were indexed.
- Net yield: (4)-(5) is the effective net yield before all other commissions
- Management fee: this is inbestMe’s management fee. The inbestMe management fee ranges from 0.12% to 0.25% depending on the volume. We always use the higher cost to make these calculations, therefore, investors with accounts over €100,000 should have a few extra tenths of profitability.
- Custody or trading: this is the cost of GVC Gaesco’s custody for mutual fund accounts or the cost of trading and custody for ETF accounts.
- Estimated variable yield: (6)-(7)-(8) is the best estimate we can make of the variable yield.
- Published variable yield: is the estimated variable yield (9) rounded up.
- The effective weighted yield of the funds: this is the result of weighting each fund’s weekly yield by its weight in the account. It is the equivalent of (4) estimated gross effective yield but refined on a weekly basis with actual data.
- Effective variable yield: is the equivalent of (9) but tuned on a weekly basis to actual data.
- Effective-published difference: this is the difference, if any, between (10) and (12) and will tend to be 0. In the client area, the client will always have the closest calculation we have available.