In the current macroeconomic situation, a lot of uncertainty persists. The circumstances are certainly peculiar, and it is difficult to find similarities with the past. This produces a lot of noise and uncertainty regarding the future direction of financial markets. Analysts are wildly divided on the fact that equity indices should go up or down, or that interest rates should continue to rise or fall back lower.
In all this uncertainty, there is anyway something that cannot be denied: the landscape for fixed income investing has radically changed during the last year. In November 2022, we already anticipated that a new era for bonds was beginning.
Although we are not very keen on regularly revising the return expectations of our portfolios, this situation in fixed income has prompted us to review all the parameters of our portfolios this year after a very special year 2022.
By buying for zero or negative yield just some months ago, clearly the expected return could not be great. Still, private investors and financial institutions had to buy bonds for risk diversification purposes.
Today, the expected return for bonds is clearly changed. In the US, the yield to maturity of a 10-year Treasury bond is around 4%, in Europe is around 3%. Even more striking is the fact that even short term interest rates are high. 1 year US rates are above 5%, 1 year German rates are above 3%. This makes a striking difference compared with the zero interest rates of the last few years.
So, if calculating the expected returns of stock is a probabilistic exercise, whose assumptions are often questionable, the normalization of the fixed income market from the exceptional circumstances of the last few years is incontrovertible. Fixed income heavy portfolios have now clearly a higher expected return than in the recent past.
So, the main change to the expected returns in our portfolios are exactly on the less risky portfolios, where the weight of the fixed income component is heavier.
The following are our current revised assumptions for the annualized return over the next 10 years for the main asset class that we have in our strategic portfolios.
| Euro government bonds | 3,00% |
| Euro aggregate | 3,25% |
| Euro Corp IG | 3,75% |
| Global bonds | 3,75% |
| US Treasuries | 4,00% |
| Eur Inflation Linked | 4,00% |
| Euro Corp HY | 5,50% |
| US Stocks | 7,50% |
| Japan Stocks | 9,00% |
| Asia ex-japan | 9,00% |
| Real estate | 7,00% |
| EU Stocks | 9,00% |
| EM Stocks | 10,00% |
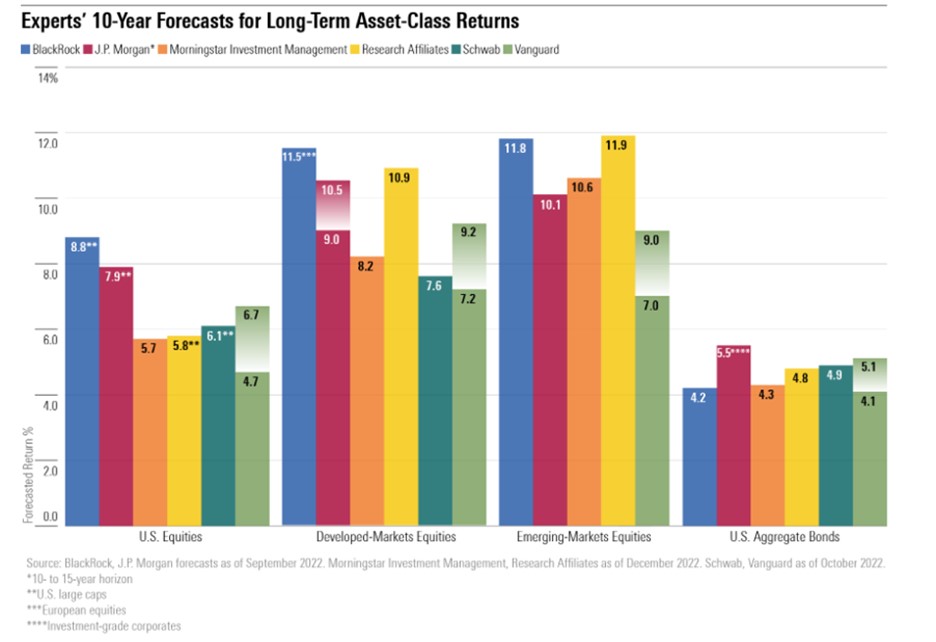
For reference, this is how our expectations compare with the ones of some of the world’s biggest investment houses.
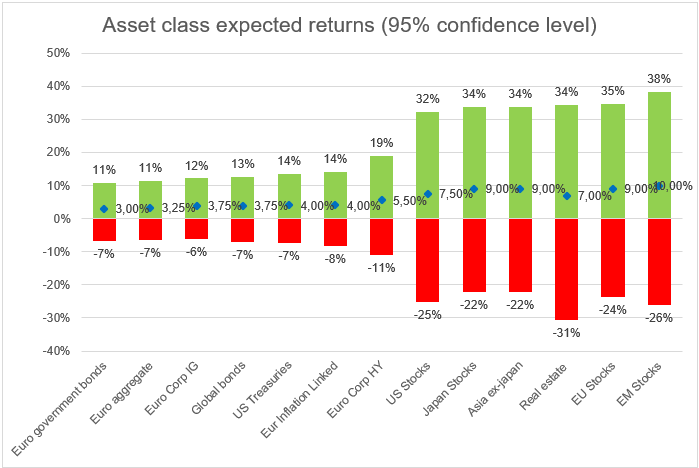
How shall these assumptions be considered? It has to be clear that in any case this is not a forecast and that the return effectively achieved each year will vary, sometimes significantly, around these numbers.
Supposing that returns are normally distributed, and taking into account the volatility of each of the instruments, we can define an interval within which the effective return is likely to be located. In the graph below, we have represented the expected return and the range within which the return should fall around 95% of the time. In 5% of the cases, the return could fall outside these levels.
When these assets are assembled into our portfolios, this give rise to the following expected returns.
The picture since last year changes, especially for low profiles:
- with the 0 going to 2.2% from 0.85%,
- the 1 to 2.80% from 1.80%
- and the 2 to 3.50% from 2.90%.
The other changes are minor or almost negligible.
As of this 2023 these will be the new expected returns that will be shown in the simulations in our graphs of each investment plan.
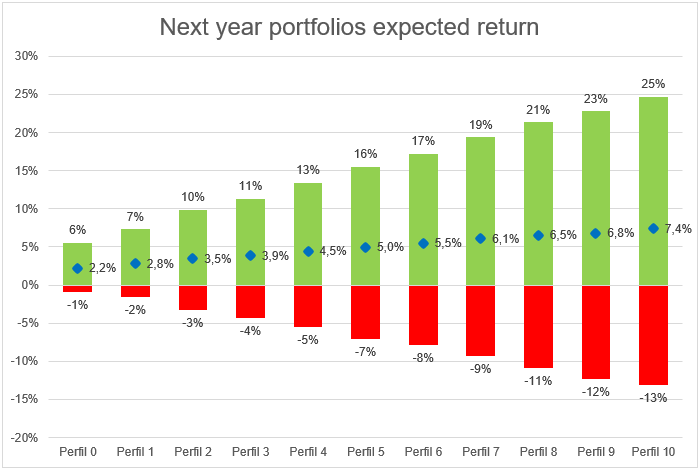
Again, it is important to remember that in no case is this a guaranteed return and that the actual return obtained from each profile each year will vary as much or more as the height of the bars shown in the graph above (graphical expression of volatility).
For example, a profile 5 has an expected annual return of 5%, but the “normal” (with a 95% degree of confidence) is that it varies between -9% and +17%. Most likely, we will never see that 5% in a specific year, but rather that figure will be the average return over the medium to long term.
The situation has changed since last year, especially for the lower profiles, which have risen significantly, especially in relative terms:
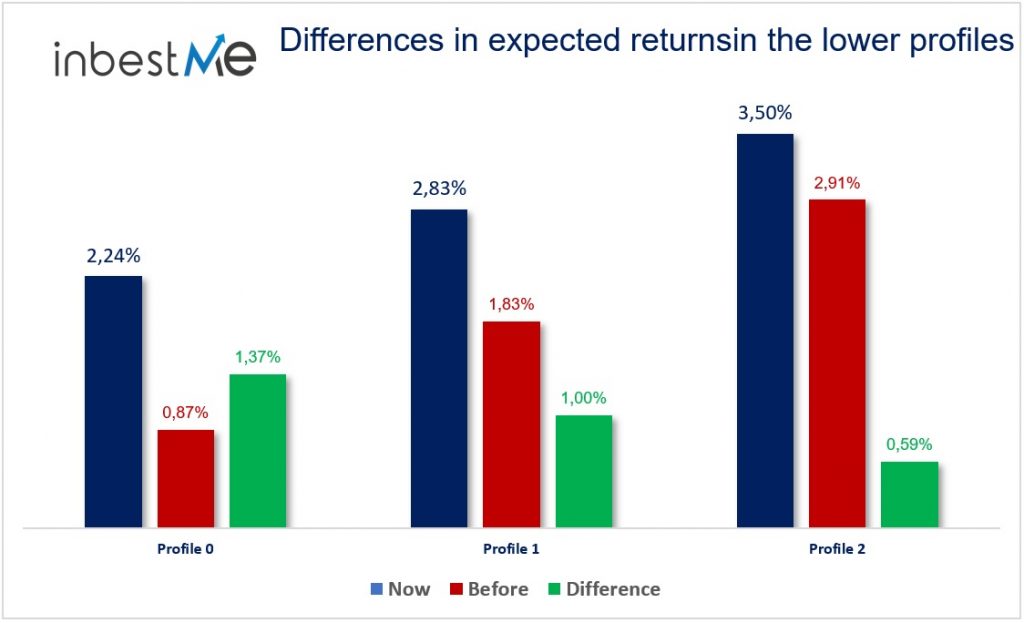
- The expected return on profile 0 is up 1.37% to 2.24% from 0.87%
- Profile 1 expected return rises 1% to 2.83% from 1.83%,
- Profile 2 return up 0.59% to 3.5% from 2.91%.
In addition to reviewing the profiles from 0 to 2, we have taken the opportunity to adjust all the other profiles where relatively much smaller differences are observed and also the volatilities as we will see below.
ADJUSTMENT OF VOLATILITY
In view of the special situation already discussed above and for the first time, we have decided to revise the expected volatilities we have used from the beginning in a conservative manner, taking advantage of the already long history of our portfolios (since 2015) during which they have had a lower volatility than initially expected, also in very difficult times.
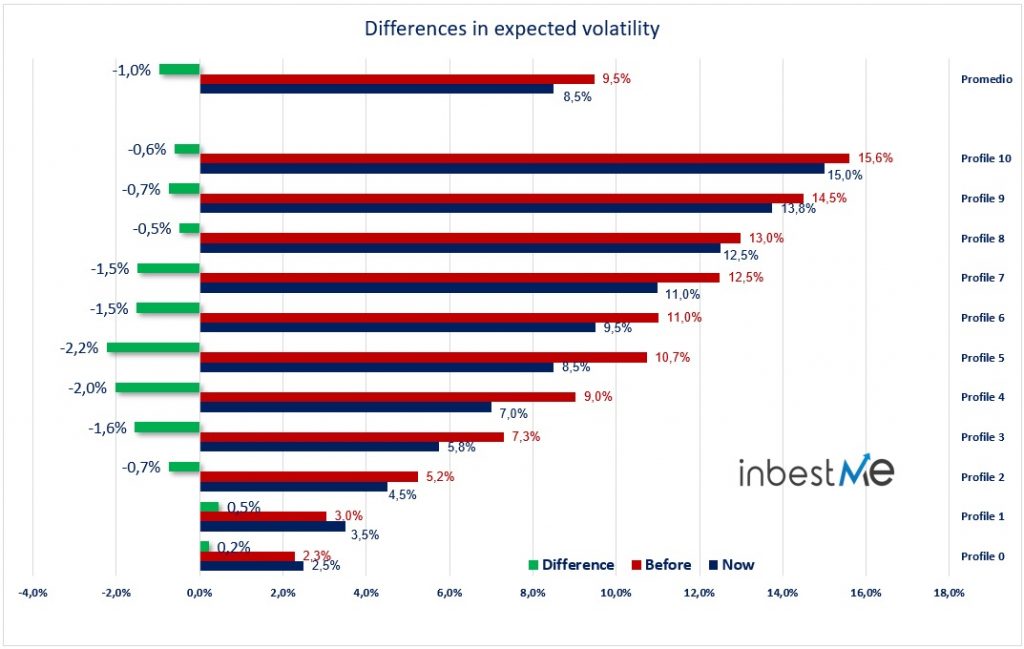
As can be seen in the graph above, we have adjusted the volatilities downwards: on average, they are reduced by 1%, while in the intermediate profiles (4 to 7) the decreases are 2% or more.
All these changes were made at the beginning of March 2023. However, it should be noted that these changes were tacitly effective as of January 2023 and will be shown in the simulations in our graphs for each investment plan and in the plan simulation graph in the client area.
These changes are extensible to all our portfolios, as they are used as a basis for all of them, although in reality they may have expectations a few tenths different in profitability or volatility profile to profile and a different behavior year to year as has already happened in the past.