
2022 is proving to be the worst year of the last decades for diversified portfolios. In the past, we experienced equity indices losses that were much more severe than the current ones, but we never experienced this kind of correlated moves in which bonds fall together with stocks.
If we look at the most followed stock market index, the S&P 500, it is down 24% since the beginning of the year and the Bloomberg Global Aggregate bond index is down 19% since the beginning of the year.
The 60/40 portfolio (60% US stocks and 40% 10y US Treasuries), which is usually considered the benchmark for diversified portfolios, is now down 21% since the beginning of the year.

Cartera: 60% US Total stock market – 40% 10y Treasury
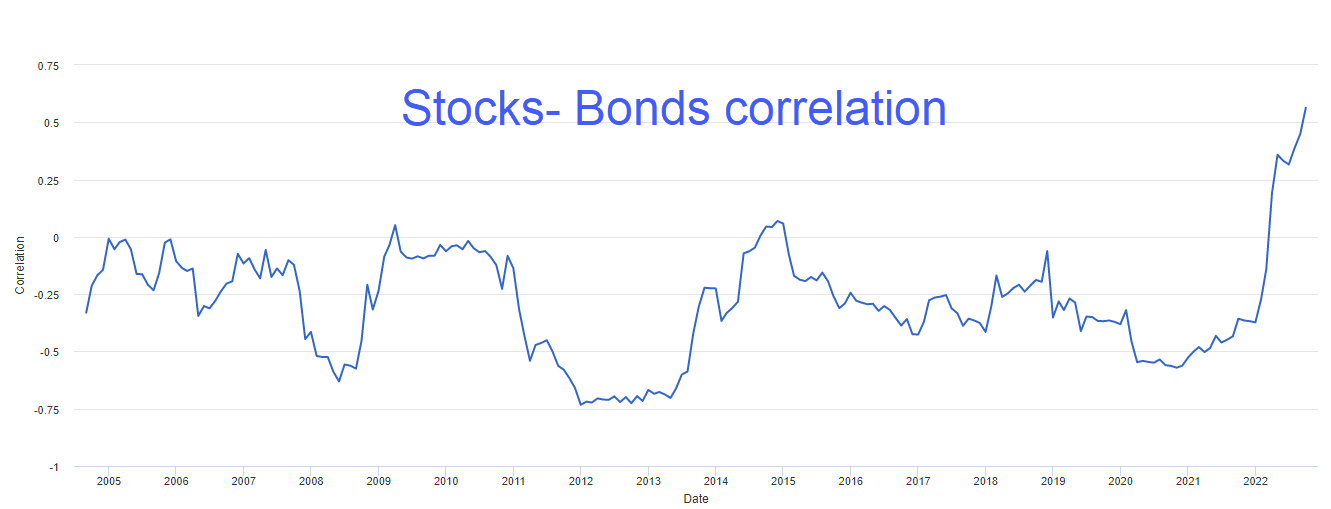
The graph below represents the evolution of the correlation between stocks and bonds in the last years. An increase of the correlation means that the two major asset classes increase their tendency to move together. The correlation of the last 30 years was negative while during the last year it has clearly moved to positive. This is usually the case when the main concern is inflation, so for a return of some negative correlation, it is required that the inflation comes back under control.
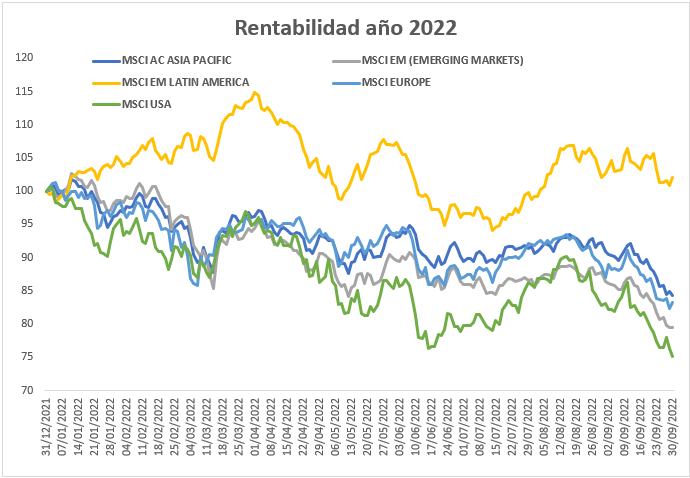
If we look at the performance of the equity macro areas, only Latin America was positive this year due to its exposure to commodities but Latin America weight in global indices is very low. USA was the worst area when expressed in local currency but we have to consider that the dollar appreciated around 15% against euro this year so this would mean a lower loss for foreign investors that invested in US assets.
Bonds were hit by the fact that both risk-free interest rates and corporate bond spreads went higher. As we know (link) when interest rates go higher, the price of the bonds currently in circulation tends to fall. This increases the return that an investor could now obtain buying the bond (at the lower price) and keeping it to maturity. Through the decrease in price, the bond is kept in line with the higher returns that are now available in the market from similar bonds. This is what happened in the first part of the crisis, when it was mainly the expectation of central banks increasing official interest rates to push the prices of the bonds lower.
During the last months, the pressure on bonds started to come also from credit spreads, which are the additional compensation over risk-free rates that investors ask for holding bonds that have a certain risk of default. The increase in corporate bond spread is due to the higher expectation of an economic slowdown that could make it more difficult for companies to repay their debt obligations.
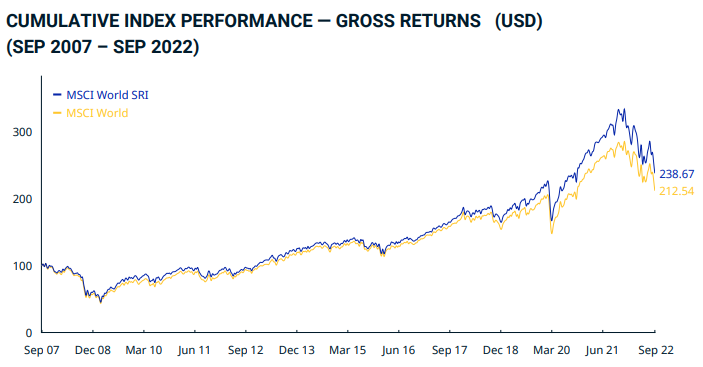
Global bonds lost all the gains accumulated during these last few years as it can be seen from the graph below that shows the performance of the Bloomberg Global Aggregate bond index which is the most comprehensive global bond index.
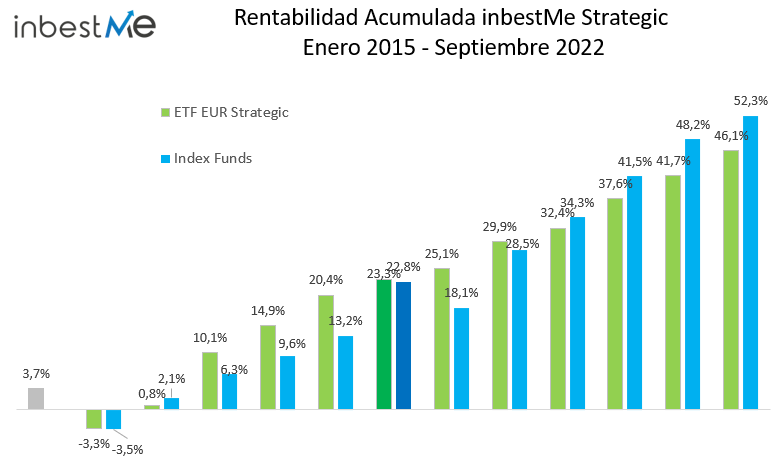
The graph starts from Jan 2015 which is the date in which we started to keep track of the performance of our portfolios.

Portfolio performance
On the back of the losses on basically all asset classes, our portfolios show a loss in 2022. The graph below shows the performance of the two main long term strategic carteras, in ETF and index funds. ETF carteras performed slightly better for because of the investment in gold and equity value that is not available for index funds.

Among all the other lines of carteras that we offer apart from strategic ones, the ones that on average are performing better are the dynamic ones that are the only ones managed with a more tactical approach whose main objective is to reduce risk when the trend is negative. This year they are doing what are designed for, which is to reduce the volatility and the drawdown in difficult periods.
The portfolios which are performing the worst are the dollar ones, mainly due to currency movements. Given that the dollar this year appreciated against almost all other currency, any foreign currency exposure of a portfolio denominated in dollars weights on dollar performance.

This year is not proving to be very favourable for SRI indices: The MSCI World Index lost 25.10% since the beginning of the year, while the MSCI World SRI lost 28.2%. This is mainly due to the fact that SRI Indices have a higher percentage of technology, one of the sectors more hit by the increase in interest rates, and consumer discretionary, a sector that was hit by expectations of an economic slowdown. SRI indices also have a lower exposure to traditional energy due to the most severe exposure of the sector to environmental, social and governance risk. Energy this year benefited from the increase in prices followed to the end of the pandemic and to the start of the war in Ukraine.
This does not change the fact that, over the last years, SRI indices performed better than conventional indices. At the end of September 2022, the MSCI World SRI Index had an annualized performance of 9.56% over the last 10 years against an annual performance of 8.69% of the MSCI World Index.

2022 in a longer term context
As mentioned above, certainly 2022 was so far the worse year for diversified portfolios. Usually, when an asset goes down another goes up, or at least it does not go down as much. Putting in a portfolio assets that do not move together is the essence of risk management.
This year it did not work because all assets were hit by the sudden increase in inflation. This is certainly not the normal case and diversification of risks remain the best long-term strategy to cope with an uncertain world.
Despite this year episode, the performance of our portfolios, that are built on the premise of the diversification of risks, remains clearly positive since their inception.
The only portfolio 0 performance is now negative. This portfolio is 100% bonds and it suffered from the fact that bonds (as we showed above) lost all the performance accumulated since 2015.
Same considerations as far as the average TAE of our portfolios is concerned which is clearly above the TAE of the average Spanish mutual fund.

Comparación detallado del comportamiento de nuestras carteras vs las diferentes categorías de los fondos de inversión
This applies also if we compare the different Inbestme portfolios to the relevant category of Spanish mutual funds.
En el gráfico siguiente vemos una comparación de todos los perfiles de nuestras carteras comparadas a las diferentes categorías de las estadísticas de Inverco de los fondos de inversión en España, so that we can compare our carteras with mutual funds that cover the same asset class and have a similar risk profile.
Low risk profiles (0 and 1 ) are benchmarked against Renta Fija mixta nmutual funds, profiles 2 and 3 are compared with Renta Fija Mixta international, average risk profiles from 4 to 8 are compared with renta variable mixta international and the most risky portfolios are compared with RV international.

Clearly there are periods in which indexed portfolios suffer the most and the current one is one of those periods. But the evidence is quite clear that low cost, diversified portfolios build with passive instruments beats active management over the long term (Spiva report https://www.spglobal.com/spdji/en/documents/spiva/spiva-us-year-end-2021.pdf).
Carteras Dynamic
Let’s conclude talking about dynamic carteras. These carteras are managed in a more tactical way compared to strategic carteras with the main goal of reducing volatility and drawdowns.
In particular, they are managed on the basis of a trendfollowing model whose main objective is to reduce risks when market trend is lower. On the basis of this, the equity risk of the carteras has been reduced in the last few months with the objective of reducing the severity of drawdowns.
These carteras are managed by dividing them in a core portfolio and a satellite portfolio to which is allocated part of the total equity exposure and whose weights are tactically managed. To the satellite portfolio is allocated between 10 and 28% of the equity exposure, depending on the risk profile of the cartera.
This year the risk has been reduced in the satellite part of the portfolios given that equity indices are in a downtrend. This determined an overperformance of dynamic carteras compared to strategic carteras. Recently we have added a small allocation (25% of the possible equity allocation in the satellite portfolios) to quality stocks. These kind of stocks, that have relatively stronger balance sheets, should be better equipped to face the economic slowdown that central banks interest rates hikes are probably going to cause.


2 Comments
This is a very short and crispy method of understanding the subject. It is really helpful and gives confidence too.
Thanks to you
Hello,
thank you for your comment. Best regards