Experts often talk about volatile markets to refer markets fall. It is better to call a spade a spade: most of the time when we talk about volatility, we really mean crashes.
When markets fall, as for example in recent weeks, investors often question whether it makes sense to invest. When your portfolio temporarily loses value, it can be very tempting to try to minimize your losses by stopping your investment plan or your recurring contributions to your investment account (or even cancelling your investment account). What happens, and this may be counter-intuitive to most, is that in a bear market environment, what looks better is worse.
Which market situation do we prefer?
If we take a moment to reflect, we will understand why it is important (and even beneficial) to continue investing despite being in a bearish (or volatile) environment.
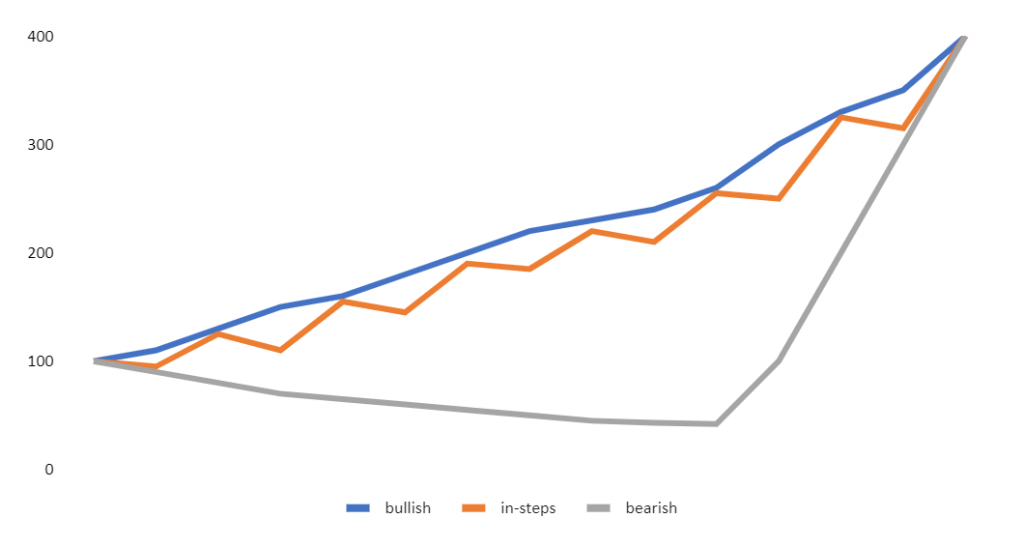
We have simulated three scenarios that could occur in, say, in fifteen years. In all three scenarios we invest €1000 per year in a basket of index funds or EFTs. We have defined the three scenarios as:
- Bullish, continued rises in the stock markets (blue).
- In steps, the market is going up but has corrections (orange).
- Bearish, the market has ten years of declines to recover at the end (gray).
Stop for a moment and ask yourself, which chart do you prefer?
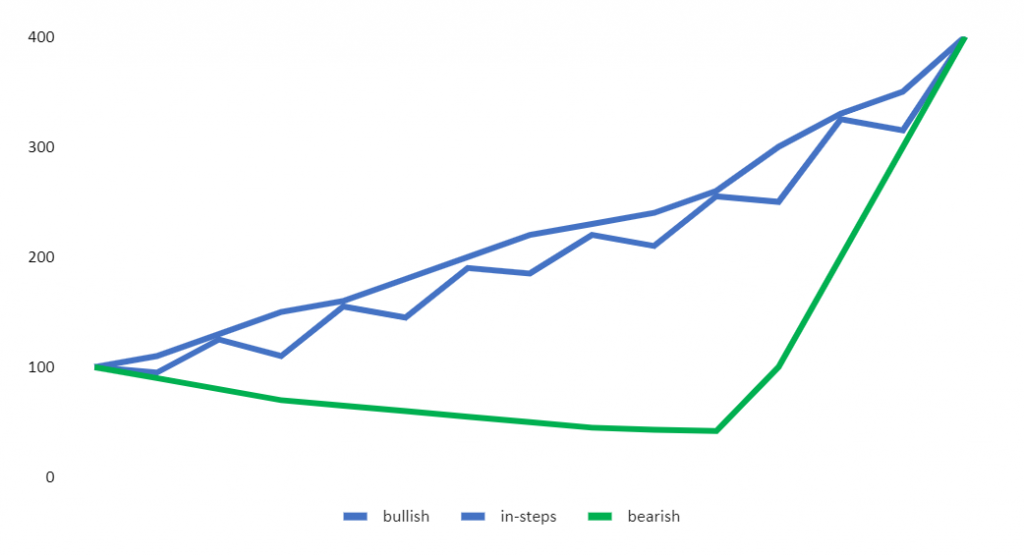
To help you, in the chart above, we have changed the colours to see if we can condition you…
Although in this version of the chart the bull market is in grey, we are sure that for most of you it would be your choice, right?
Certainly, from a psychological point of view it is the easiest to support. Why? Because we see how, period by period, our investment is growing continuously, there are no falls or shocks during the whole period, it is the ideal world for our mind.
We can also support the step market. The staggered market is like what happens in real markets fall and after rises there are falls and these follow each other endlessly with regularity. There can be sharp falls, but in this case the corrections are smooth. If we educate our mind minimally, we will manage to go ahead with our investment plan.
The one that seems difficult to bear, without a doubt, is the one we have called bear market, is it easy to endure 10 years of falls?
What seems better is the worst
In the following table, we will show that it is the opposite.
| Prices | Shares Purchased | Cumulative Shares | Portfolio Value | ||||||||||
| Date | Bullish | In-Steps | Bearish | Bullish |
In-Steps |
Bearish |
Bullish | In-Steps |
Bearish |
Bullish |
In-Steps | Bearish |
|
| 01/01/2022 | 1 | 100 | 100 | 100 | 10,00 | 10,00 |
10,00 |
10,00 |
10,00 |
10,00 |
1.000 | 1.000 |
1.000 |
| 01/01/2023 | 2 | 110 | 95 | 90 | 9,09 | 10,53 | 11,11 | 19,09 | 20,53 | 21,11 | 2.100 | 1.950 | 1.900 |
| 01/01/2024 | 3 | 130 | 125 | 80 | 7,69 | 8,00 | 12,50 | 26,78 | 28,53 | 33,61 | 3.482 | 3.566 | 2.689 |
| 01/01/2025 | 4 | 150 | 110 | 70 | 6,67 | 9,09 | 14,29 | 33,45 | 37,62 | 47,90 | 5.017 | 4.138 | 3.353 |
| 01/01/2026 | 5 | 160 | 155 | 65 | 6,25 | 6,45 | 15,38 | 39,70 | 44,07 | 63,28 | 6.352 | 6.831 | 4.113 |
| 01/01/2027 | 6 | 180 | 145 | 60 | 5,56 | 6,90 | 16,67 | 45,26 | 50,97 | 79.95 | 8.146 | 7.390 | 4.797 |
| 01/01/2028 | 7 | 200 | 190 | 55 | 5,00 | 5,26 | 18,18 | 50,26 | 56,23 | 98,13 | 10.051 | 10.683 | 5.397 |
| 01/01/2029 | 8 | 220 | 185 | 50 | 4,55 | 5,41 | 20,00 | 54,80 | 61,63 | 118,13 | 12.056 | 11.402 | 5.907 |
| 01/01/2030 | 9 | 230 | 220 | 45 | 4,36 | 4,55 | 22,22 | 59,15 | 66,18 | 140,35 | 13.604 | 14.559 | 6.316 |
| 01/01/2031 | 10 | 240 | 210 | 43 | 4,17 | 4,76 | 23,26 | 63,32 | 70,94 | 163,61 | 15.196 | 14.898 | 7.035 |
| 01/01/2032 | 11 | 260 | 255 | 42 | 3,85 | 3,92 | 23,81 | 67,16 | 74,86 | 187,42 | 17.462 | 19.090 | 7.872 |
| 01/01/2033 | 12 | 300 | 250 | 100 | 3,33 | 4,00 | 10,00 | 70,49 | 78,86 | 197,42 | 21.148 | 19.716 | 19.742 |
| 01/01/2034 | 13 | 330 | 325 | 200 | 3,03 | 3,08 | 5,00 | 73,53 | 81,94 | 202,42 | 24.263 | 26.630 | 40.483 |
| 01/01/2035 | 14 | 350 | 315 | 300 | 2,86 | 3,17 | 3,33 | 76,38 | 85,11 | 205,75 | 26.734 | 26.811 | 61.725 |
| 01/01/2036 | 15 | 400 | 400 |
400 |
2,50 | 2,50 | 2,50 | 78,88 | 87,61 | 208,25 | 31.553 | 35.046 | 83.300 |
| 01/01/2036 | APR | 10% | 11% | 22% | |||||||||

What appears to be the best is the worst.
That is, what is psychologically easier to bear turns out to be the worst option from the point of view of the final return on our investments.
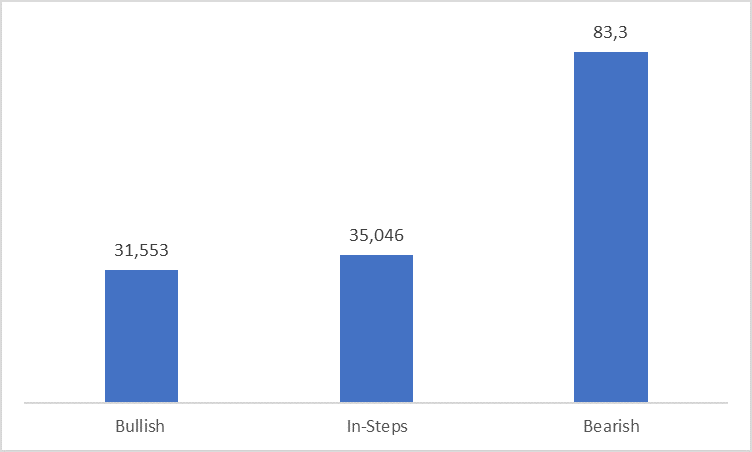
If we look at the graph above, we see that from a numerical point of view, the worst (bear market) is clearly the best, and we accumulated the maximum, €83,300. On the other hand, what is easier to bear, what we have called the bull market, is the worst from a profitability point of view, since we only accumulated €31,553. The scenario we have called in steps would be an intermediate case in which we obtain €35,046.
The market remunerates risk when the markets fall
In the graph below we see the same picture if we plot the APRs of the three different scenarios.
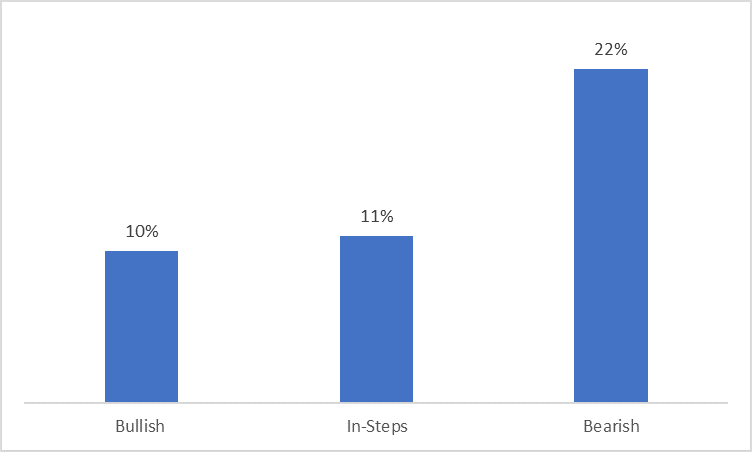
The bullish scenario has the worst APR at 10%. Step market gets a slightly better APR at 11% and the market we have labelled as bearish clearly gets the best APR at 22%.
Why does this happen? If we go back to the table above, we can clearly see why. The more the market falls, the more shares we accumulate with our, €1000.
In the first case, in round numbers, we accumulate seventy-eight shares of our imaginary basket, in the second eighty-seven shares and in the third many more, 208 shares.
As in the end the three scenarios end up at the same point, in both the staircase and bearish scenarios we have accumulated more shares which in the end have more value. Let us remember that the market remunerates risk.
There are even strategies that consist of investing more money when the market is lower.
Do not get carried away by the fear of loss when markets fall.
We have already discussed on other occasions that our brain is not prepared to bear losses and that the fear of losing does not let us win, since we are much more sensitive to losses than to gains, and that makes us make incoherent decisions.
What this example demonstrates is that temporary losses in the long run lose importance; a volatile or falling market can actually be better for investors, because it gives them the opportunity to buy at a discount. It is funny that buying at a discount is something we easily understand in other types of purchases, clothing, appliances, even when we think about buying an apartment. But we have a tough time understanding the concept of bargain when we buy financial assets. It should be easier to understand when we buy the best indexes in the world (our portfolios are composed of the best world indexes).
We are not recommending, on the other hand, to wait for market crashes to invest because it is impossible to guess the best time to enter or exit the market.
The lesson is that you should try to ignore short-term market noise especially if you intend to invest consistently and that you are investing for the medium to long term (the ideal and most recommended situation).
Markets fall but, after it, have a natural upward trend. Therefore, if your investment horizon is quite long (at least 3 to 5 years), what happens in the short term does not matter.
We are aware that this is easier said than done. Losing money causes us uncertainty and discomfort, even if it is only for a few months. Even the most experienced investor suffers from it too. But it is important to remember that volatility and downturns are normal in investing, and you do not actually lose money unless you sell your investments. Remember, if you are investing for the long term, you do not need to sell. History shows that markets fall but after, they tend to go up over the long term, which means that if you stick to your recurring investment plan and keep investing, history and statistics indicate that you will most likely come out ahead.

Appendix: a real-life example in “the lost decade” when “Markets Fall”.
The decade of the 2000s is often referred to in the financial environment as the lost decade. This is because in 2000/2001 the dot.com bubble burst and, on the other hand, because between 2007 and 2009 the great financial crisis occurred.
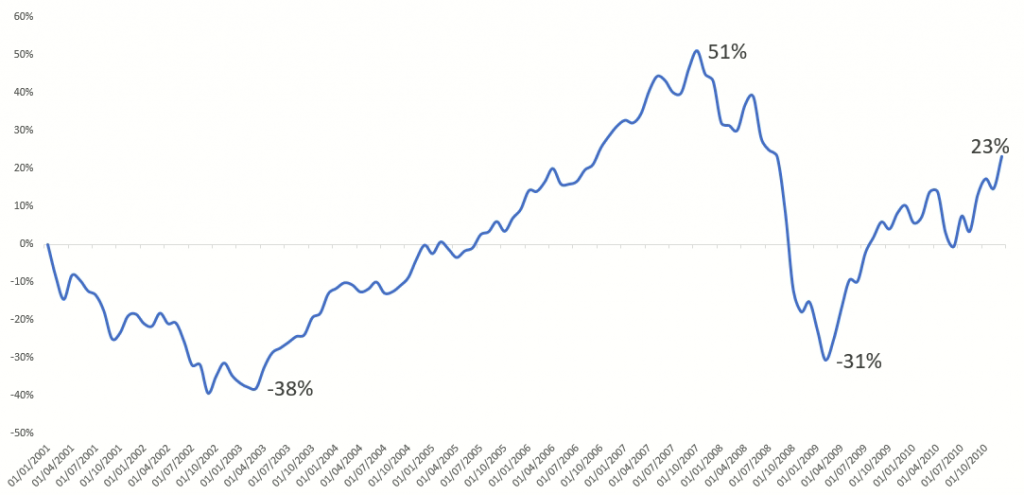
Even so, on 31/12/2010 the price of the MSCI World, for example, was 23% higher than on 1/1/2001. Of course, as we can see in the graph, an investor who had invested in this period would have had to accept a first fall of -38% and then a worse one, in the great financial crisis of -45%. Truly difficult times to invest.
Does this mean that an investor who had maintained his plan and invested recurrently would have been ruined in this period?
Not at all! It would not have been the best decade to invest, but if we look at the table below….
… An investor who had invested 10,000 € every year would have obtained an APR of 5% and accumulated about 25,000 € of profit, if he had not panicked at the worst moments.
On the contrary, an investor who in the middle of the stock market crisis had sold, for example, at 31/12/2008 would have lost 7,000 €, an especially significant difference compared to earning 25,000 €, of 32,000 €.
In any case, no one can deny that the 2000s were not the best period for investing.
| Date | Price | Shares | Shares.Acum | NAV | APR |
| 31/12/2001 | 2069,098 | 4,833024 | 4,883024 | 10.000 | -10.000 |
| 31/12/2002 | 1657,636 | 6,032668 | 10,86571 | 18011.39 | -10.000 |
| 31/12/2003 | 2206,423 | 4,532223 | 15,39793 | 33976.36 | -10.000 |
| 31/12/2004 | 2531,228 | 3,950652 | 19,34859 | 48975.68 | -10.000 |
| 31/12/2005 | 2771,33 | 3,608376 | 22,95696 | 63621.32 | -10.000 |
| 31/12/2006 | 3327,426 | 3,005326 | 25,96229 | 86387.59 | -10.000 |
| 31/12/2007 | 3628,073 | 2,756284 | 28,71857 | 104193.1 | -10.000 |
| 31/12/2008 | 2150,99 | 4,649022 | 33,36759 | 71773.36 | -10.000 |
| 31/12/2009 | 2796,035 | 3,576493 | 36,94409 | 103297 | -10.000 |
| 31/12/2010 | 3124,941 | 3,20006 | 40,14415 | 125448.1 | -10.000 |
| 31/12/2010 | 125448,1 | ||||
| APR | 5% |
In the graph above we compare the lost decade (in blue) with the decade 2010 to 2020 (in red). The comparison is clearly in favor of the latter decade, accumulating 146% versus 23%.
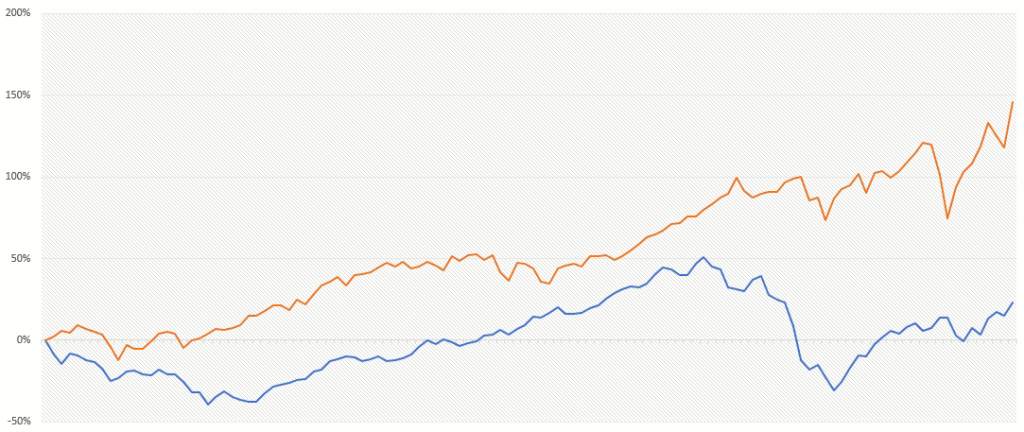
As we can see in the table above, an investor with the same plan (investing 10,000 € each year) would have obtained an APR of 11% much higher than the 5% mentioned above.
This indicates that there are clearly better periods (or decades, in this case) to invest than others. But it is impossible to predict this in advance. If it is already difficult to guess what will happen in a year, how will it be possible to guess what will happen in a decade?
That is why the recipe of continuing to invest no matter what happens is still valid, even considering the variability of market returns over time. So do not worry if markets fall, they will grow up again.
| Date | Price | Shares | Shares.Acum | NAV | APR |
| 31/12/2011 | 2951,809 | 3,39 | 9,39 | 10000.00 | -10.000 |
| 31/12/2012 | 3418,961 | 2,92 | 6,31 | 21582.60 | -10.000 |
| 31/12/2013 | 4331,022 | 2,31 | 8,62 | 37340.09 | -10.000 |
| 31/12/2014 | 4544,837 | 2,20 | 10,82 | 49183.50 | -10.000 |
| 31/12/2015 | 4505,241 | 2,22 | 13,04 | 58755.00 | -10.000 |
| 31/12/2016 | 4843,607 | 2,06 | 15,11 | 73167.79 | -10.000 |
| 31/12/2017 | 5928,591 | 1,69 | 16,79 | 99557.62 | -10.000 |
| 31/12/2018 | 5412,122 | 1,85 | 18,64 | 100884.66 |
-10.000 |
| 31/12/2019 | 6909,66 | 1,45 | 20,09 | 138779.52 | -10.000 |
| 31/12/2020 | 8008,468 | 1,25 | 21,34 | 170872.10 | -10.000 |
| 31/12/2020 | 170872.1 | ||||
| APR | 11% |