We have referred in the past to the excellent results of our retirement plan portfolios:
- We did so at the close of the first year, which was confirmed with a particularly superior performance at the end of October 2021.
In this post we analyze again the evolution of our retirement plan portfolios at the end of 2021.
Excellent performance of our retirement plan portfolios (year-end 2021).
The year 2021 has been a good year for the financial markets in general and this was also reflected in our portfolios and especially in our retirement plan portfolios.
To put these results in context, let us look at the following chart, where we compare the data of inbestMe’s retirement plan portfolios with the weighted average of retirement plans in Spain, according to Inverco in the year 2021.
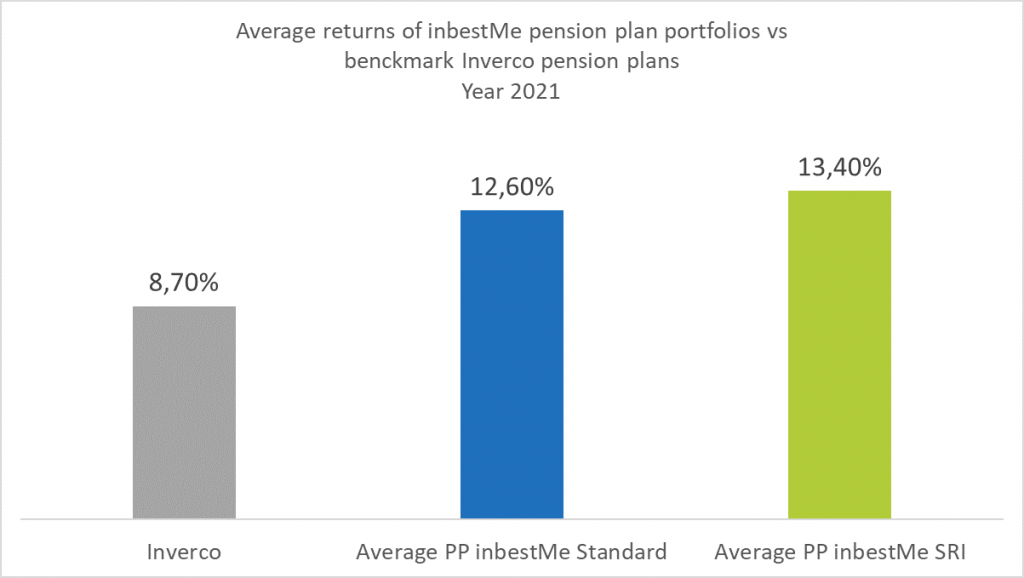
We can see in the graph above how the average return of inbestMe’s standard retirement plan portfolios (+12.6%) has clearly exceeded by almost four percentage points the average weighted return of retirement plans in Spain (+8.7%) according to Inverco’s statistics for 2021.
In the chart we have also included for illustrative purposes the backtest, the average return of our recently launched SRI Retirement Plan portfolios (in blue). Our SRI Retirement Plan portfolios would have further improved this average to 13.4% increasing the spread versus Inverco to 4.7 percentage points.
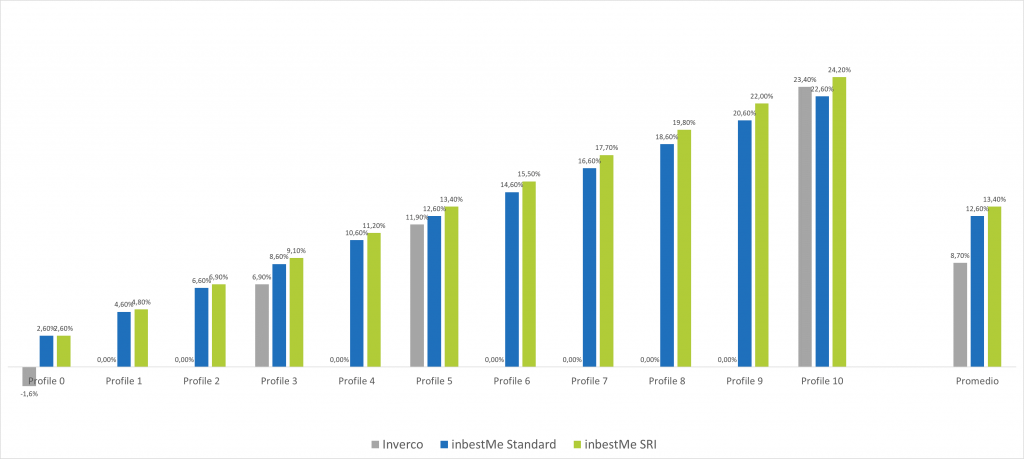
In the following graph, we make the same comparison, but we do the analysis by introducing the category[1] closest to each profile.
If we look at the detail by risk profile, our standard retirement plan portfolios (in green in the graph) in 2021 had excellent returns between 2.6% and 22.6% with an average of 12.6%.
Overall, in all categories our portfolios outperform the corresponding category, and what is reflected in the better overall average 12.6% vs. 8.7% for Inverco. It is also noteworthy that all portfolios ended in positive territory even in a difficult year for fixed income, where the benchmark ended at -1.6%.
[1]Detail of the categories of the Inverco statistics used as benchmark:
- From profiles 0 to 2: Long-term fixed income
- Profiles 3 to 4: Mixed fixed income
- From profile 5 to 9: Mixed Equities
- The profile 10: Equities
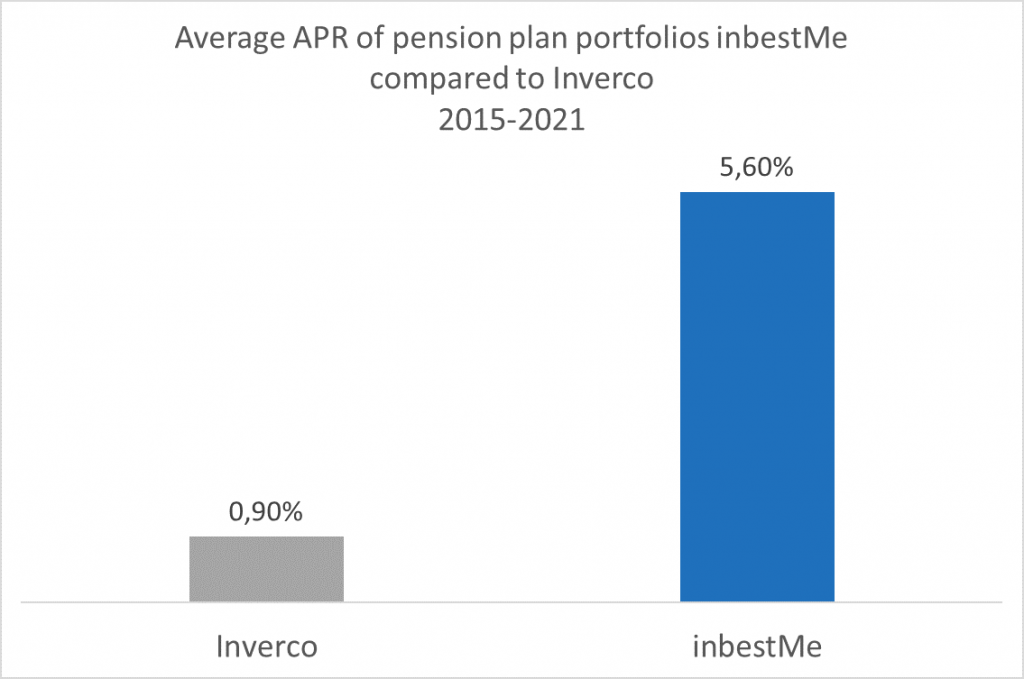
Excellent comparative performance of our pension portfolios
We prefer to focus our attention on medium- to long-term analysis. The outperformance of our retirement plans in 2021 is not an isolated fact. As we see in the chart above, the average APR of inbestMe’s2 retirement plan portfolios would have been 5.6% which is 4.7 percentage points higher than the weighted average APR of retirement plans in Spain from 2015 to 2021.
These results show that it is possible to have exceptionally good returns in retirement plans, similar or even higher than those obtained by our index funds or EFT portfolios, beyond the tax breaks that can be obtained.
According to these statistics, there are many Spaniards who obtain returns far below the performance of our retirement plan portfolios. We suggest anyone reading this post to review their retirement plan and compare it with the results we have been reporting. We remind you that it is easy to transfer your retirement plan to inbestMe if it is inefficient.
For those inbestMe clients who do not yet have a retirement plan, we recommend you do the same or contact our customer service to discuss the steps to follow if you have any doubts.
2 Important note: our portfolios were launched in 2020. Therefore, in this analysis there are two actual years 2020 and 2021 and 2015 to 2019 comes from a back test.
Alternatively, you can request a comparison of your retirement plans (or mutual funds) online before making the transfer.

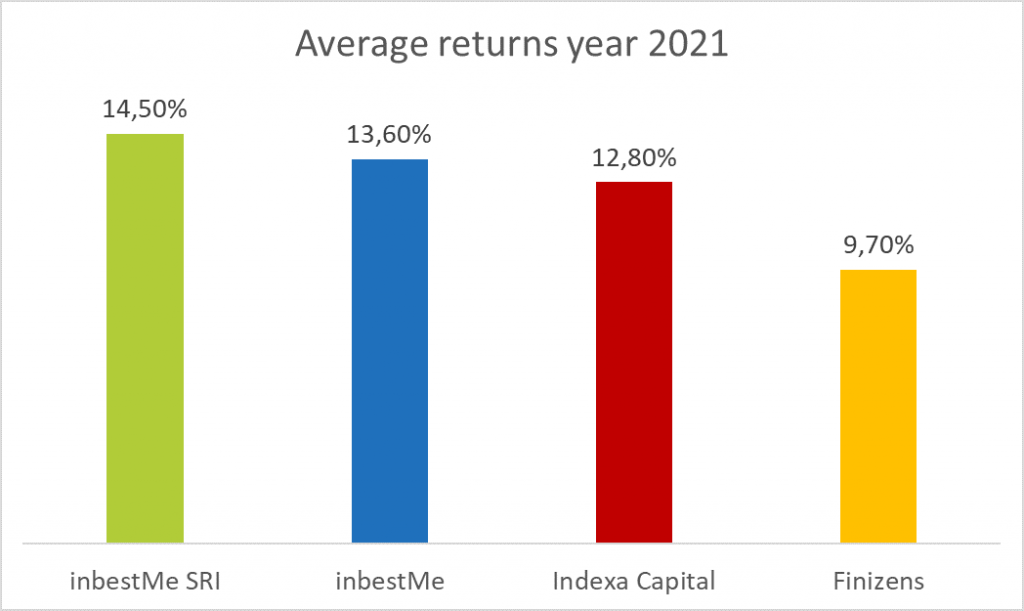
Excellent comparative performance of our retirement plan portfolios
We have again compared the performance of our retirement plan portfolios with similar services at the end of 2021.
As we can see, the average returns of our retirement plan portfolios outperform similar services of the competitors represented in the graph.
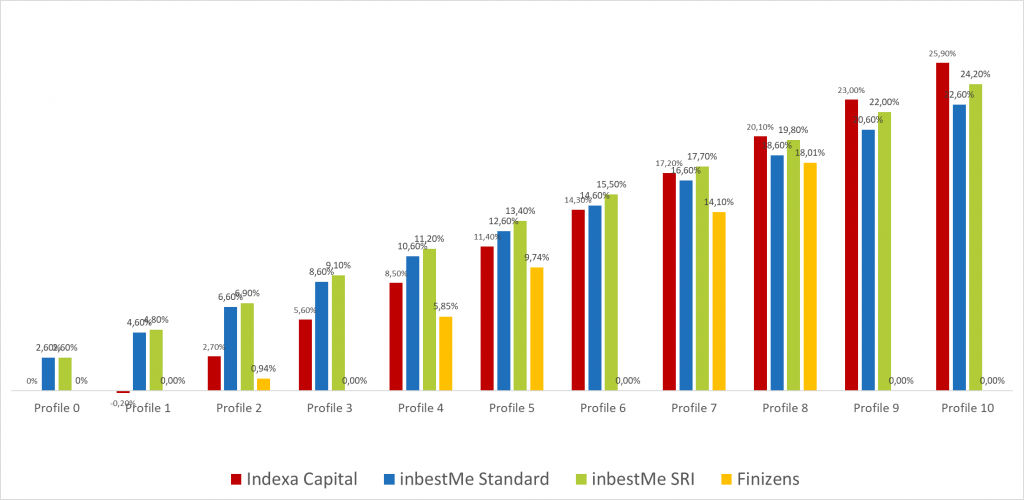
If we look in more detail and by profile, our portfolio of indexed retirement plans clearly outperform or match those of our competitors from profile 1 to 8. Only in profile 9 and 10 does Indexa capital outperform inbestMe.
As for Finizens, the comparison is not 100% homogeneous: Finizens offer only includes five profiles out of the eleven available by inbestMe. The average of 9.7% is four percentage points lower than inbestMe’s 13.6%, partly for this reason. Even so, looking at the comparable Finizens’ profiles, we see how inbestMe’s return is higher by between one percentage point and five percentage points.
Undoubtedly, our offer of indexed retirement plan portfolios consolidates as one of the best options in the financial market in Spain.

Appendix
These comparisons were made using the same methodology we used in the October 2021 comparison. See here (add link to appendix article October 2021).
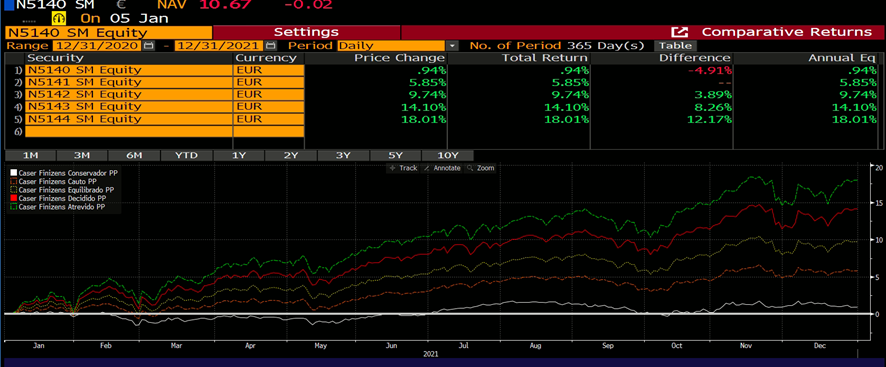
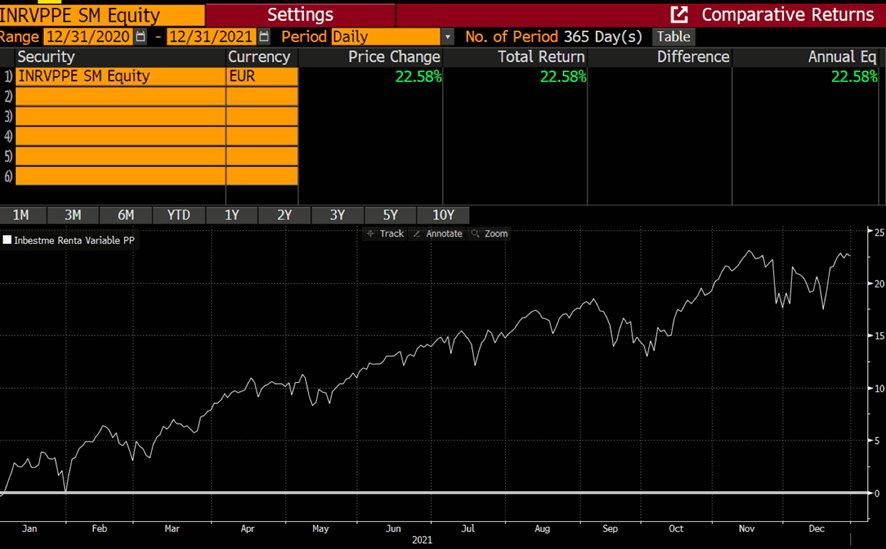
Below we have included an update of the base information from Bloomberg at the end of 2021, which were used to make these comparisons again and ensure that the extraction is homogeneous.
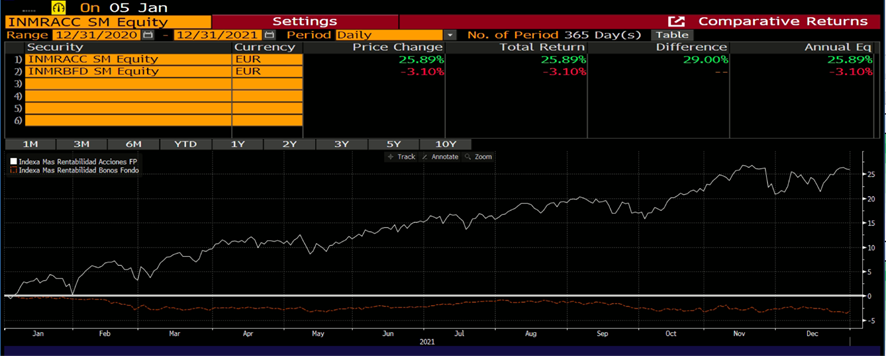
For the performance of the inbestMe Fixed Income Retirement Plan we have had to use the same methodology explained above. The return of the inbestMe Fixed Income Retirement Plan was 2.6%. We added the Excel of reconversion of the information. Let us see if it makes sense.
As mentioned above, the performance of the inbestMe ISR retirement plan portfolios are the product of a backtest plus real data as of November 2021.
Remember that past performance is no guarantee of future performance. Beyond this, one of the virtues of indexing is that it guarantees us to obtain a percentage close to 100% of what the benchmark of each index fund or ETF we use to build our portfolios obtains. This makes relative historical performance and backtests, although not a guarantee, a good indicator at a comparative level.